Immigrants from Oceania vs Immigrants from North Macedonia Seniors Poverty Over the Age of 65
COMPARE
Immigrants from Oceania
Immigrants from North Macedonia
Seniors Poverty Over the Age of 65
Seniors Poverty Over the Age of 65 Comparison
Immigrants from Oceania
Immigrants from North Macedonia
10.4%
SENIORS POVERTY OVER THE AGE OF 65
88.4/ 100
METRIC RATING
130th/ 347
METRIC RANK
9.6%
SENIORS POVERTY OVER THE AGE OF 65
99.6/ 100
METRIC RATING
41st/ 347
METRIC RANK
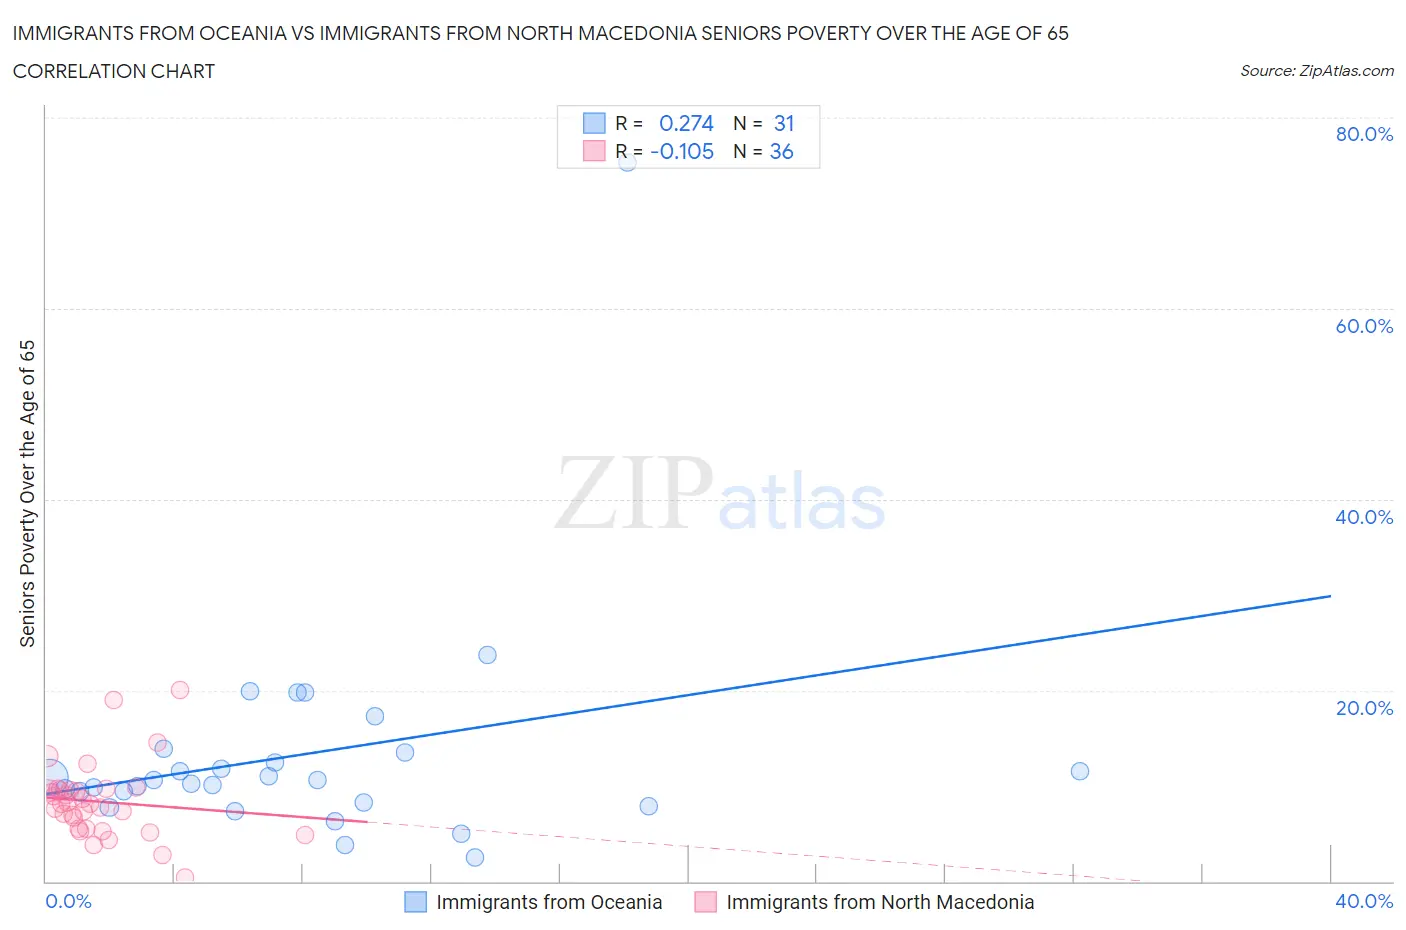
Immigrants from Oceania vs Immigrants from North Macedonia Seniors Poverty Over the Age of 65 Correlation Chart
The statistical analysis conducted on geographies consisting of 304,434,853 people shows a weak positive correlation between the proportion of Immigrants from Oceania and poverty level among seniors over the age of 65 in the United States with a correlation coefficient (R) of 0.274 and weighted average of 10.4%. Similarly, the statistical analysis conducted on geographies consisting of 74,265,150 people shows a poor negative correlation between the proportion of Immigrants from North Macedonia and poverty level among seniors over the age of 65 in the United States with a correlation coefficient (R) of -0.105 and weighted average of 9.6%, a difference of 8.8%.
Seniors Poverty Over the Age of 65 Correlation Summary
| Measurement | Immigrants from Oceania | Immigrants from North Macedonia |
| Minimum | 2.5% | 0.44% |
| Maximum | 75.3% | 20.0% |
| Range | 72.8% | 19.6% |
| Mean | 13.3% | 8.3% |
| Median | 10.6% | 8.1% |
| Interquartile 25% (IQ1) | 8.3% | 5.5% |
| Interquartile 75% (IQ3) | 13.5% | 9.6% |
| Interquartile Range (IQR) | 5.2% | 4.1% |
| Standard Deviation (Sample) | 12.5% | 3.9% |
| Standard Deviation (Population) | 12.3% | 3.9% |
Similar Demographics by Seniors Poverty Over the Age of 65
Demographics Similar to Immigrants from Oceania by Seniors Poverty Over the Age of 65
In terms of seniors poverty over the age of 65, the demographic groups most similar to Immigrants from Oceania are Immigrants from Iran (10.4%, a difference of 0.0%), Ottawa (10.4%, a difference of 0.020%), Cambodian (10.4%, a difference of 0.15%), Egyptian (10.5%, a difference of 0.15%), and Immigrants from Hungary (10.4%, a difference of 0.16%).
| Demographics | Rating | Rank | Seniors Poverty Over the Age of 65 |
| Hmong | 90.0 /100 | #123 | Exceptional 10.4% |
| Asians | 89.9 /100 | #124 | Excellent 10.4% |
| Immigrants | Philippines | 89.4 /100 | #125 | Excellent 10.4% |
| Immigrants | Hungary | 89.1 /100 | #126 | Excellent 10.4% |
| Cambodians | 89.1 /100 | #127 | Excellent 10.4% |
| Ottawa | 88.5 /100 | #128 | Excellent 10.4% |
| Immigrants | Iran | 88.4 /100 | #129 | Excellent 10.4% |
| Immigrants | Oceania | 88.4 /100 | #130 | Excellent 10.4% |
| Egyptians | 87.8 /100 | #131 | Excellent 10.5% |
| Immigrants | Turkey | 87.7 /100 | #132 | Excellent 10.5% |
| Guamanians/Chamorros | 87.5 /100 | #133 | Excellent 10.5% |
| Sierra Leoneans | 86.8 /100 | #134 | Excellent 10.5% |
| Immigrants | Norway | 86.5 /100 | #135 | Excellent 10.5% |
| Immigrants | Serbia | 86.4 /100 | #136 | Excellent 10.5% |
| Immigrants | Australia | 85.1 /100 | #137 | Excellent 10.5% |
Demographics Similar to Immigrants from North Macedonia by Seniors Poverty Over the Age of 65
In terms of seniors poverty over the age of 65, the demographic groups most similar to Immigrants from North Macedonia are Zimbabwean (9.6%, a difference of 0.15%), Assyrian/Chaldean/Syriac (9.6%, a difference of 0.16%), Eastern European (9.6%, a difference of 0.26%), Greek (9.6%, a difference of 0.28%), and Austrian (9.6%, a difference of 0.35%).
| Demographics | Rating | Rank | Seniors Poverty Over the Age of 65 |
| British | 99.8 /100 | #34 | Exceptional 9.4% |
| Latvians | 99.8 /100 | #35 | Exceptional 9.5% |
| Czechoslovakians | 99.8 /100 | #36 | Exceptional 9.5% |
| Scotch-Irish | 99.7 /100 | #37 | Exceptional 9.5% |
| Belgians | 99.7 /100 | #38 | Exceptional 9.5% |
| Greeks | 99.6 /100 | #39 | Exceptional 9.6% |
| Assyrians/Chaldeans/Syriacs | 99.6 /100 | #40 | Exceptional 9.6% |
| Immigrants | North Macedonia | 99.6 /100 | #41 | Exceptional 9.6% |
| Zimbabweans | 99.6 /100 | #42 | Exceptional 9.6% |
| Eastern Europeans | 99.6 /100 | #43 | Exceptional 9.6% |
| Austrians | 99.5 /100 | #44 | Exceptional 9.6% |
| Estonians | 99.5 /100 | #45 | Exceptional 9.6% |
| Immigrants | Taiwan | 99.5 /100 | #46 | Exceptional 9.7% |
| Immigrants | South Central Asia | 99.5 /100 | #47 | Exceptional 9.7% |
| French | 99.5 /100 | #48 | Exceptional 9.7% |