Immigrants from Armenia vs Immigrants from North Macedonia Seniors Poverty Over the Age of 65
COMPARE
Immigrants from Armenia
Immigrants from North Macedonia
Seniors Poverty Over the Age of 65
Seniors Poverty Over the Age of 65 Comparison
Immigrants from Armenia
Immigrants from North Macedonia
15.2%
SENIORS POVERTY OVER THE AGE OF 65
0.0/ 100
METRIC RATING
326th/ 347
METRIC RANK
9.6%
SENIORS POVERTY OVER THE AGE OF 65
99.6/ 100
METRIC RATING
41st/ 347
METRIC RANK
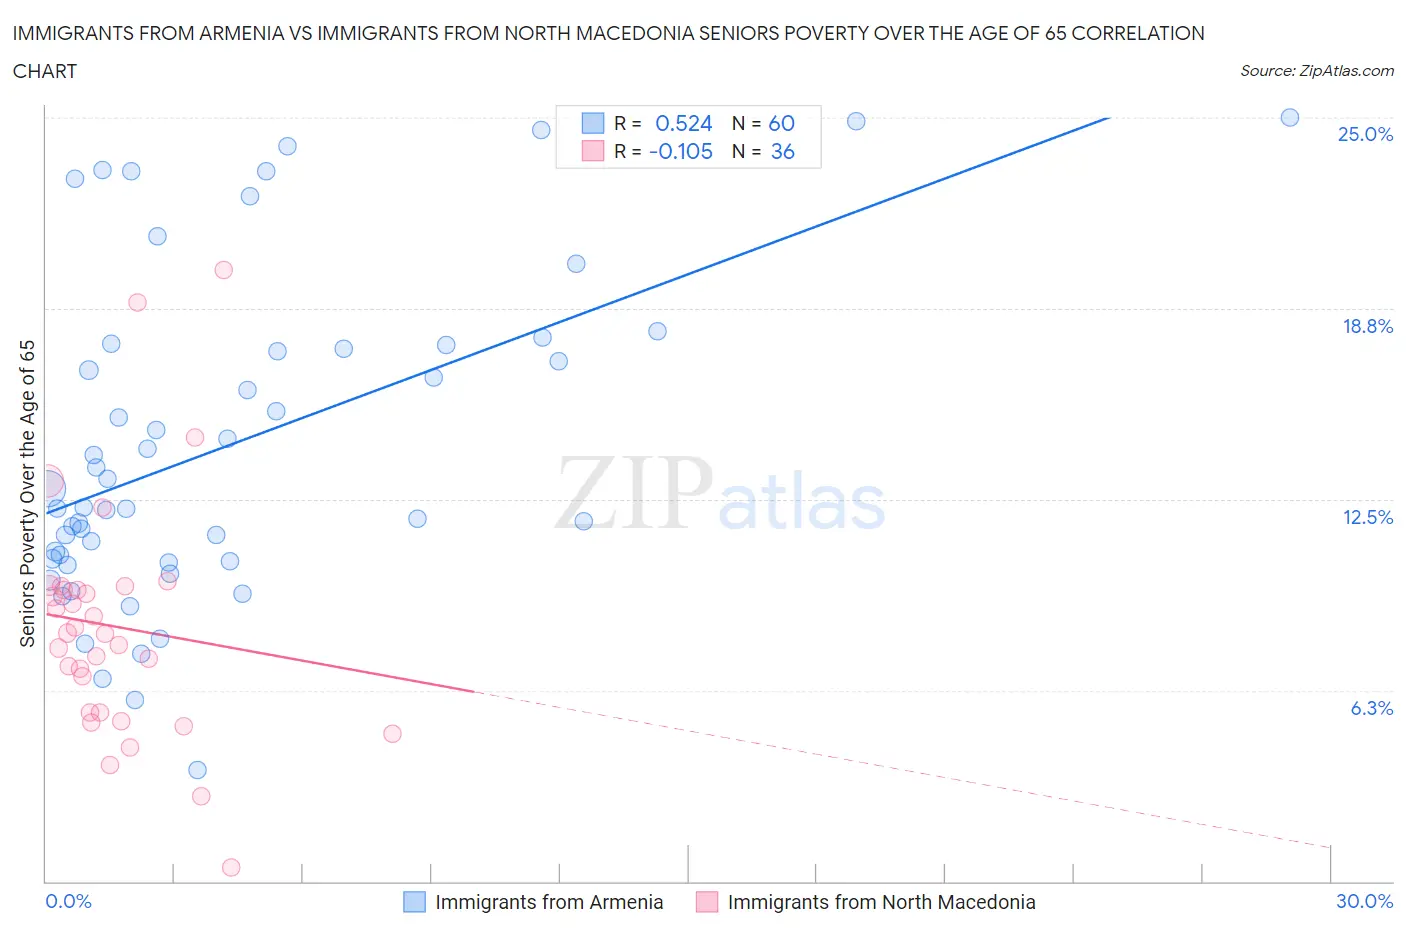
Immigrants from Armenia vs Immigrants from North Macedonia Seniors Poverty Over the Age of 65 Correlation Chart
The statistical analysis conducted on geographies consisting of 97,583,648 people shows a substantial positive correlation between the proportion of Immigrants from Armenia and poverty level among seniors over the age of 65 in the United States with a correlation coefficient (R) of 0.524 and weighted average of 15.2%. Similarly, the statistical analysis conducted on geographies consisting of 74,265,150 people shows a poor negative correlation between the proportion of Immigrants from North Macedonia and poverty level among seniors over the age of 65 in the United States with a correlation coefficient (R) of -0.105 and weighted average of 9.6%, a difference of 58.2%.
Seniors Poverty Over the Age of 65 Correlation Summary
| Measurement | Immigrants from Armenia | Immigrants from North Macedonia |
| Minimum | 3.6% | 0.44% |
| Maximum | 25.0% | 20.0% |
| Range | 21.4% | 19.6% |
| Mean | 14.3% | 8.3% |
| Median | 12.5% | 8.1% |
| Interquartile 25% (IQ1) | 10.5% | 5.5% |
| Interquartile 75% (IQ3) | 17.5% | 9.6% |
| Interquartile Range (IQR) | 7.0% | 4.1% |
| Standard Deviation (Sample) | 5.3% | 3.9% |
| Standard Deviation (Population) | 5.3% | 3.9% |
Similar Demographics by Seniors Poverty Over the Age of 65
Demographics Similar to Immigrants from Armenia by Seniors Poverty Over the Age of 65
In terms of seniors poverty over the age of 65, the demographic groups most similar to Immigrants from Armenia are Crow (15.2%, a difference of 0.25%), Central American Indian (15.1%, a difference of 0.60%), Sioux (15.3%, a difference of 0.79%), Nicaraguan (15.0%, a difference of 1.2%), and Immigrants from Dominica (15.5%, a difference of 1.9%).
| Demographics | Rating | Rank | Seniors Poverty Over the Age of 65 |
| Cape Verdeans | 0.0 /100 | #319 | Tragic 14.7% |
| Immigrants | Haiti | 0.0 /100 | #320 | Tragic 14.7% |
| Houma | 0.0 /100 | #321 | Tragic 14.7% |
| Immigrants | Barbados | 0.0 /100 | #322 | Tragic 14.8% |
| Yakama | 0.0 /100 | #323 | Tragic 14.8% |
| Nicaraguans | 0.0 /100 | #324 | Tragic 15.0% |
| Central American Indians | 0.0 /100 | #325 | Tragic 15.1% |
| Immigrants | Armenia | 0.0 /100 | #326 | Tragic 15.2% |
| Crow | 0.0 /100 | #327 | Tragic 15.2% |
| Sioux | 0.0 /100 | #328 | Tragic 15.3% |
| Immigrants | Dominica | 0.0 /100 | #329 | Tragic 15.5% |
| Immigrants | St. Vincent and the Grenadines | 0.0 /100 | #330 | Tragic 15.5% |
| British West Indians | 0.0 /100 | #331 | Tragic 15.6% |
| Immigrants | Grenada | 0.0 /100 | #332 | Tragic 15.8% |
| Immigrants | Yemen | 0.0 /100 | #333 | Tragic 15.9% |
Demographics Similar to Immigrants from North Macedonia by Seniors Poverty Over the Age of 65
In terms of seniors poverty over the age of 65, the demographic groups most similar to Immigrants from North Macedonia are Zimbabwean (9.6%, a difference of 0.15%), Assyrian/Chaldean/Syriac (9.6%, a difference of 0.16%), Eastern European (9.6%, a difference of 0.26%), Greek (9.6%, a difference of 0.28%), and Austrian (9.6%, a difference of 0.35%).
| Demographics | Rating | Rank | Seniors Poverty Over the Age of 65 |
| British | 99.8 /100 | #34 | Exceptional 9.4% |
| Latvians | 99.8 /100 | #35 | Exceptional 9.5% |
| Czechoslovakians | 99.8 /100 | #36 | Exceptional 9.5% |
| Scotch-Irish | 99.7 /100 | #37 | Exceptional 9.5% |
| Belgians | 99.7 /100 | #38 | Exceptional 9.5% |
| Greeks | 99.6 /100 | #39 | Exceptional 9.6% |
| Assyrians/Chaldeans/Syriacs | 99.6 /100 | #40 | Exceptional 9.6% |
| Immigrants | North Macedonia | 99.6 /100 | #41 | Exceptional 9.6% |
| Zimbabweans | 99.6 /100 | #42 | Exceptional 9.6% |
| Eastern Europeans | 99.6 /100 | #43 | Exceptional 9.6% |
| Austrians | 99.5 /100 | #44 | Exceptional 9.6% |
| Estonians | 99.5 /100 | #45 | Exceptional 9.6% |
| Immigrants | Taiwan | 99.5 /100 | #46 | Exceptional 9.7% |
| Immigrants | South Central Asia | 99.5 /100 | #47 | Exceptional 9.7% |
| French | 99.5 /100 | #48 | Exceptional 9.7% |