Immigrants from Northern Europe vs Yaqui Seniors Poverty Over the Age of 65
COMPARE
Immigrants from Northern Europe
Yaqui
Seniors Poverty Over the Age of 65
Seniors Poverty Over the Age of 65 Comparison
Immigrants from Northern Europe
Yaqui
9.8%
SENIORS POVERTY OVER THE AGE OF 65
99.2/ 100
METRIC RATING
54th/ 347
METRIC RANK
11.9%
SENIORS POVERTY OVER THE AGE OF 65
1.9/ 100
METRIC RATING
232nd/ 347
METRIC RANK
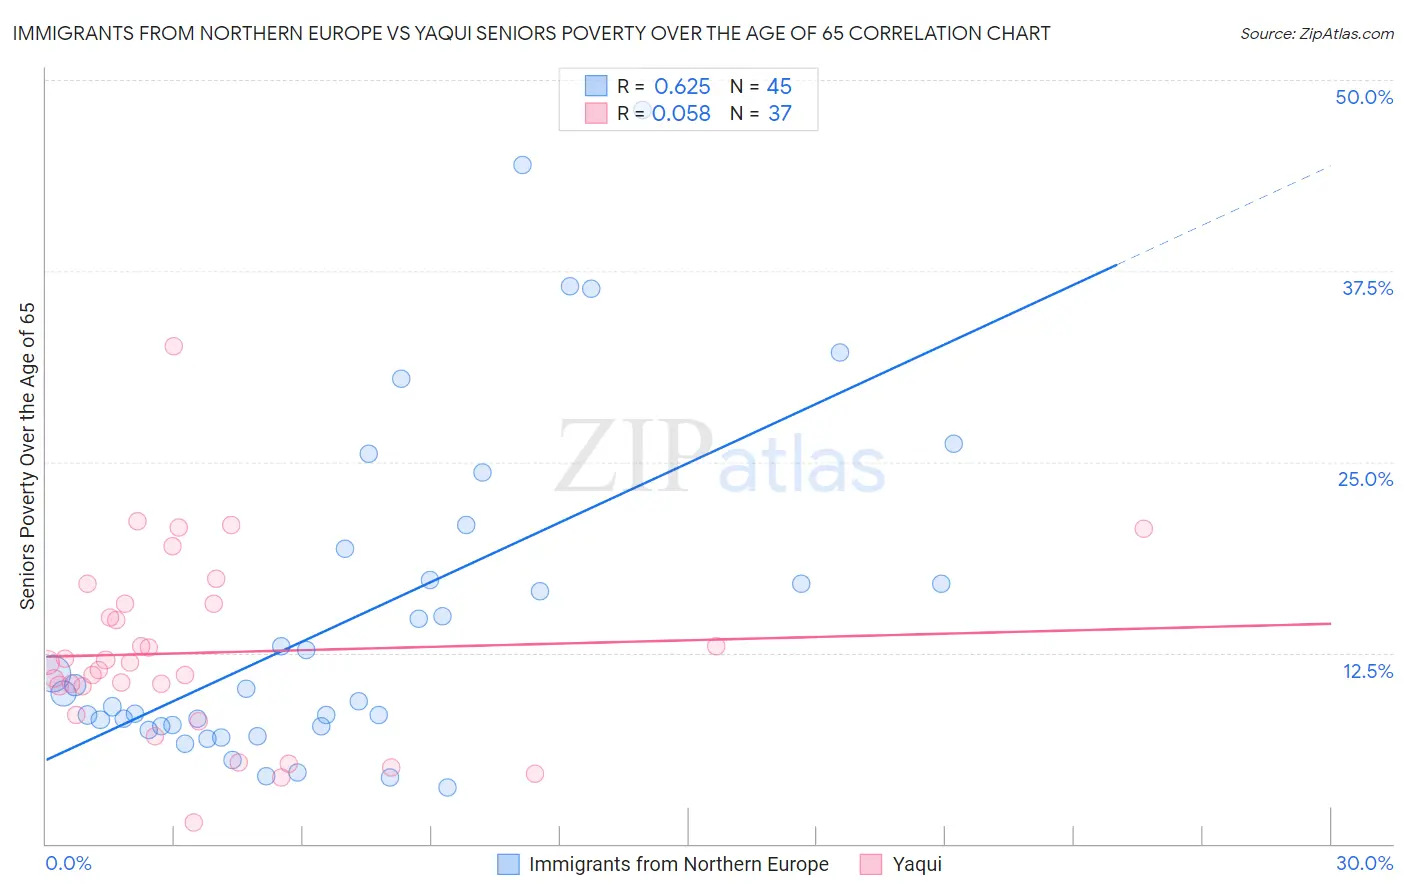
Immigrants from Northern Europe vs Yaqui Seniors Poverty Over the Age of 65 Correlation Chart
The statistical analysis conducted on geographies consisting of 474,875,758 people shows a significant positive correlation between the proportion of Immigrants from Northern Europe and poverty level among seniors over the age of 65 in the United States with a correlation coefficient (R) of 0.625 and weighted average of 9.8%. Similarly, the statistical analysis conducted on geographies consisting of 107,577,595 people shows a slight positive correlation between the proportion of Yaqui and poverty level among seniors over the age of 65 in the United States with a correlation coefficient (R) of 0.058 and weighted average of 11.9%, a difference of 21.8%.
Seniors Poverty Over the Age of 65 Correlation Summary
| Measurement | Immigrants from Northern Europe | Yaqui |
| Minimum | 3.7% | 1.4% |
| Maximum | 48.0% | 32.6% |
| Range | 44.3% | 31.2% |
| Mean | 14.8% | 12.5% |
| Median | 9.8% | 11.9% |
| Interquartile 25% (IQ1) | 7.7% | 9.4% |
| Interquartile 75% (IQ3) | 18.3% | 15.7% |
| Interquartile Range (IQR) | 10.6% | 6.4% |
| Standard Deviation (Sample) | 11.0% | 6.0% |
| Standard Deviation (Population) | 10.9% | 6.0% |
Similar Demographics by Seniors Poverty Over the Age of 65
Demographics Similar to Immigrants from Northern Europe by Seniors Poverty Over the Age of 65
In terms of seniors poverty over the age of 65, the demographic groups most similar to Immigrants from Northern Europe are Slavic (9.8%, a difference of 0.060%), Afghan (9.8%, a difference of 0.13%), Filipino (9.7%, a difference of 0.16%), Carpatho Rusyn (9.7%, a difference of 0.19%), and Immigrants from England (9.8%, a difference of 0.25%).
| Demographics | Rating | Rank | Seniors Poverty Over the Age of 65 |
| Immigrants | South Central Asia | 99.5 /100 | #47 | Exceptional 9.7% |
| French | 99.5 /100 | #48 | Exceptional 9.7% |
| Immigrants | Lithuania | 99.4 /100 | #49 | Exceptional 9.7% |
| Hungarians | 99.4 /100 | #50 | Exceptional 9.7% |
| Carpatho Rusyns | 99.3 /100 | #51 | Exceptional 9.7% |
| Filipinos | 99.3 /100 | #52 | Exceptional 9.7% |
| Slavs | 99.2 /100 | #53 | Exceptional 9.8% |
| Immigrants | Northern Europe | 99.2 /100 | #54 | Exceptional 9.8% |
| Afghans | 99.2 /100 | #55 | Exceptional 9.8% |
| Immigrants | England | 99.1 /100 | #56 | Exceptional 9.8% |
| Bolivians | 99.1 /100 | #57 | Exceptional 9.8% |
| Serbians | 99.1 /100 | #58 | Exceptional 9.8% |
| Immigrants | Canada | 99.0 /100 | #59 | Exceptional 9.8% |
| Celtics | 99.0 /100 | #60 | Exceptional 9.8% |
| Iranians | 98.9 /100 | #61 | Exceptional 9.8% |
Demographics Similar to Yaqui by Seniors Poverty Over the Age of 65
In terms of seniors poverty over the age of 65, the demographic groups most similar to Yaqui are Panamanian (11.9%, a difference of 0.10%), Cajun (11.9%, a difference of 0.14%), Bermudan (11.9%, a difference of 0.19%), Iroquois (11.9%, a difference of 0.19%), and Immigrants from Eritrea (11.8%, a difference of 0.69%).
| Demographics | Rating | Rank | Seniors Poverty Over the Age of 65 |
| Immigrants | Belarus | 3.2 /100 | #225 | Tragic 11.8% |
| Liberians | 3.2 /100 | #226 | Tragic 11.8% |
| Nigerians | 3.2 /100 | #227 | Tragic 11.8% |
| Immigrants | Costa Rica | 2.7 /100 | #228 | Tragic 11.8% |
| Immigrants | Eritrea | 2.6 /100 | #229 | Tragic 11.8% |
| Bermudans | 2.1 /100 | #230 | Tragic 11.9% |
| Cajuns | 2.0 /100 | #231 | Tragic 11.9% |
| Yaqui | 1.9 /100 | #232 | Tragic 11.9% |
| Panamanians | 1.8 /100 | #233 | Tragic 11.9% |
| Iroquois | 1.7 /100 | #234 | Tragic 11.9% |
| Immigrants | Argentina | 1.3 /100 | #235 | Tragic 12.0% |
| Immigrants | Peru | 1.3 /100 | #236 | Tragic 12.0% |
| Moroccans | 1.2 /100 | #237 | Tragic 12.0% |
| Seminole | 1.1 /100 | #238 | Tragic 12.0% |
| Immigrants | Spain | 1.0 /100 | #239 | Tragic 12.1% |