Immigrants from Northern Europe vs Yakama Seniors Poverty Over the Age of 65
COMPARE
Immigrants from Northern Europe
Yakama
Seniors Poverty Over the Age of 65
Seniors Poverty Over the Age of 65 Comparison
Immigrants from Northern Europe
Yakama
9.8%
SENIORS POVERTY OVER THE AGE OF 65
99.2/ 100
METRIC RATING
54th/ 347
METRIC RANK
14.8%
SENIORS POVERTY OVER THE AGE OF 65
0.0/ 100
METRIC RATING
323rd/ 347
METRIC RANK
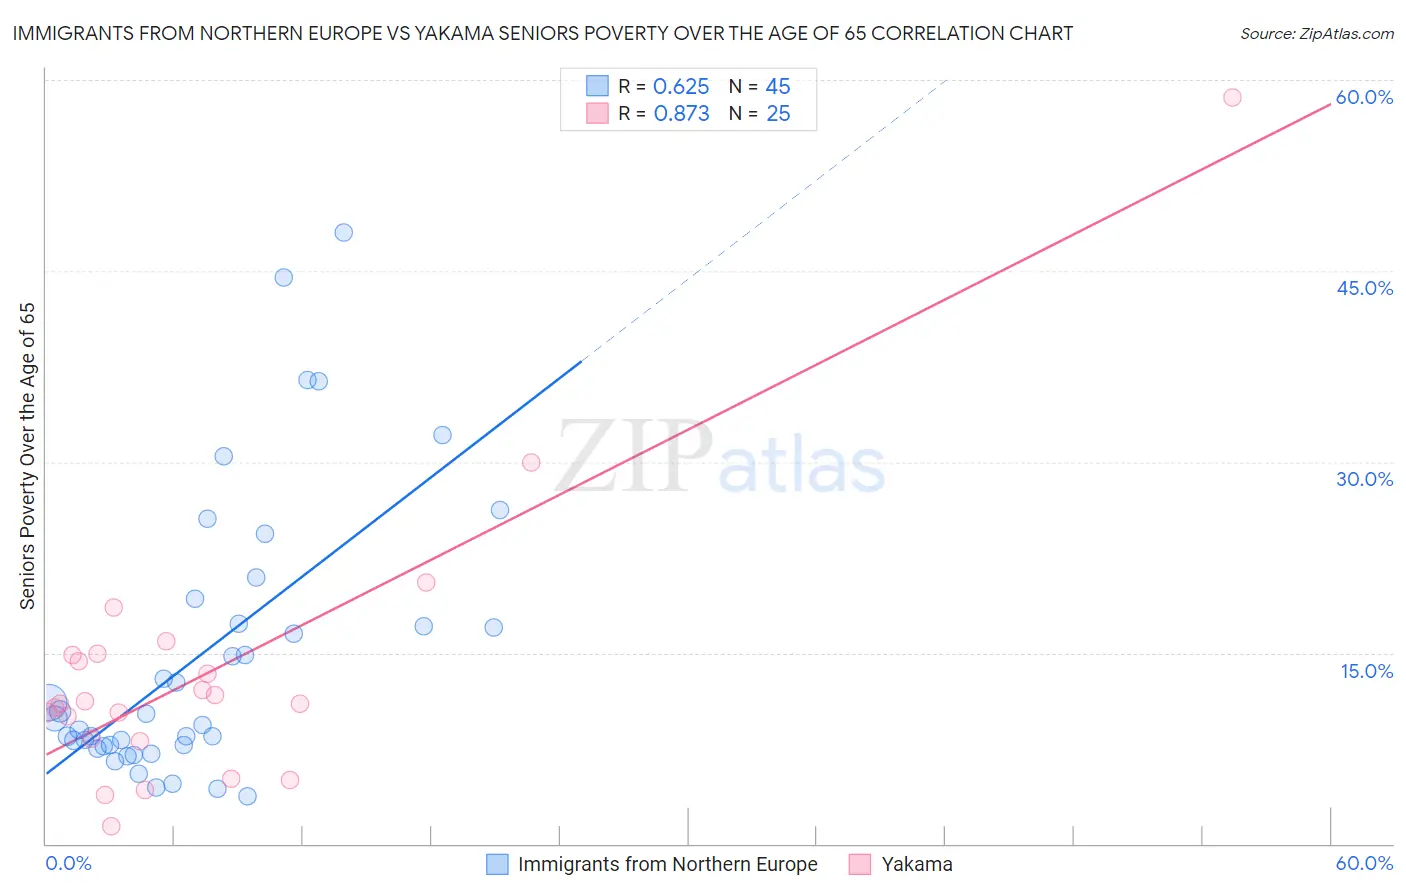
Immigrants from Northern Europe vs Yakama Seniors Poverty Over the Age of 65 Correlation Chart
The statistical analysis conducted on geographies consisting of 474,875,758 people shows a significant positive correlation between the proportion of Immigrants from Northern Europe and poverty level among seniors over the age of 65 in the United States with a correlation coefficient (R) of 0.625 and weighted average of 9.8%. Similarly, the statistical analysis conducted on geographies consisting of 19,876,988 people shows a very strong positive correlation between the proportion of Yakama and poverty level among seniors over the age of 65 in the United States with a correlation coefficient (R) of 0.873 and weighted average of 14.8%, a difference of 51.6%.
Seniors Poverty Over the Age of 65 Correlation Summary
| Measurement | Immigrants from Northern Europe | Yakama |
| Minimum | 3.7% | 1.4% |
| Maximum | 48.0% | 58.6% |
| Range | 44.3% | 57.2% |
| Mean | 14.8% | 13.4% |
| Median | 9.8% | 11.0% |
| Interquartile 25% (IQ1) | 7.7% | 8.2% |
| Interquartile 75% (IQ3) | 18.3% | 14.9% |
| Interquartile Range (IQR) | 10.6% | 6.7% |
| Standard Deviation (Sample) | 11.0% | 11.1% |
| Standard Deviation (Population) | 10.9% | 10.9% |
Similar Demographics by Seniors Poverty Over the Age of 65
Demographics Similar to Immigrants from Northern Europe by Seniors Poverty Over the Age of 65
In terms of seniors poverty over the age of 65, the demographic groups most similar to Immigrants from Northern Europe are Slavic (9.8%, a difference of 0.060%), Afghan (9.8%, a difference of 0.13%), Filipino (9.7%, a difference of 0.16%), Carpatho Rusyn (9.7%, a difference of 0.19%), and Immigrants from England (9.8%, a difference of 0.25%).
| Demographics | Rating | Rank | Seniors Poverty Over the Age of 65 |
| Immigrants | South Central Asia | 99.5 /100 | #47 | Exceptional 9.7% |
| French | 99.5 /100 | #48 | Exceptional 9.7% |
| Immigrants | Lithuania | 99.4 /100 | #49 | Exceptional 9.7% |
| Hungarians | 99.4 /100 | #50 | Exceptional 9.7% |
| Carpatho Rusyns | 99.3 /100 | #51 | Exceptional 9.7% |
| Filipinos | 99.3 /100 | #52 | Exceptional 9.7% |
| Slavs | 99.2 /100 | #53 | Exceptional 9.8% |
| Immigrants | Northern Europe | 99.2 /100 | #54 | Exceptional 9.8% |
| Afghans | 99.2 /100 | #55 | Exceptional 9.8% |
| Immigrants | England | 99.1 /100 | #56 | Exceptional 9.8% |
| Bolivians | 99.1 /100 | #57 | Exceptional 9.8% |
| Serbians | 99.1 /100 | #58 | Exceptional 9.8% |
| Immigrants | Canada | 99.0 /100 | #59 | Exceptional 9.8% |
| Celtics | 99.0 /100 | #60 | Exceptional 9.8% |
| Iranians | 98.9 /100 | #61 | Exceptional 9.8% |
Demographics Similar to Yakama by Seniors Poverty Over the Age of 65
In terms of seniors poverty over the age of 65, the demographic groups most similar to Yakama are Immigrants from Barbados (14.8%, a difference of 0.15%), Houma (14.7%, a difference of 0.54%), Immigrants from Haiti (14.7%, a difference of 0.75%), Cape Verdean (14.7%, a difference of 0.93%), and Nicaraguan (15.0%, a difference of 1.4%).
| Demographics | Rating | Rank | Seniors Poverty Over the Age of 65 |
| Immigrants | Guyana | 0.0 /100 | #316 | Tragic 14.5% |
| Haitians | 0.0 /100 | #317 | Tragic 14.5% |
| Immigrants | Honduras | 0.0 /100 | #318 | Tragic 14.5% |
| Cape Verdeans | 0.0 /100 | #319 | Tragic 14.7% |
| Immigrants | Haiti | 0.0 /100 | #320 | Tragic 14.7% |
| Houma | 0.0 /100 | #321 | Tragic 14.7% |
| Immigrants | Barbados | 0.0 /100 | #322 | Tragic 14.8% |
| Yakama | 0.0 /100 | #323 | Tragic 14.8% |
| Nicaraguans | 0.0 /100 | #324 | Tragic 15.0% |
| Central American Indians | 0.0 /100 | #325 | Tragic 15.1% |
| Immigrants | Armenia | 0.0 /100 | #326 | Tragic 15.2% |
| Crow | 0.0 /100 | #327 | Tragic 15.2% |
| Sioux | 0.0 /100 | #328 | Tragic 15.3% |
| Immigrants | Dominica | 0.0 /100 | #329 | Tragic 15.5% |
| Immigrants | St. Vincent and the Grenadines | 0.0 /100 | #330 | Tragic 15.5% |