Immigrants from Northern Europe vs Ukrainian Female Poverty Among 18-24 Year Olds
COMPARE
Immigrants from Northern Europe
Ukrainian
Female Poverty Among 18-24 Year Olds
Female Poverty Among 18-24 Year Olds Comparison
Immigrants from Northern Europe
Ukrainians
19.4%
FEMALE POVERTY AMONG 18-24 YEAR OLDS
95.4/ 100
METRIC RATING
120th/ 347
METRIC RANK
19.0%
FEMALE POVERTY AMONG 18-24 YEAR OLDS
98.8/ 100
METRIC RATING
94th/ 347
METRIC RANK
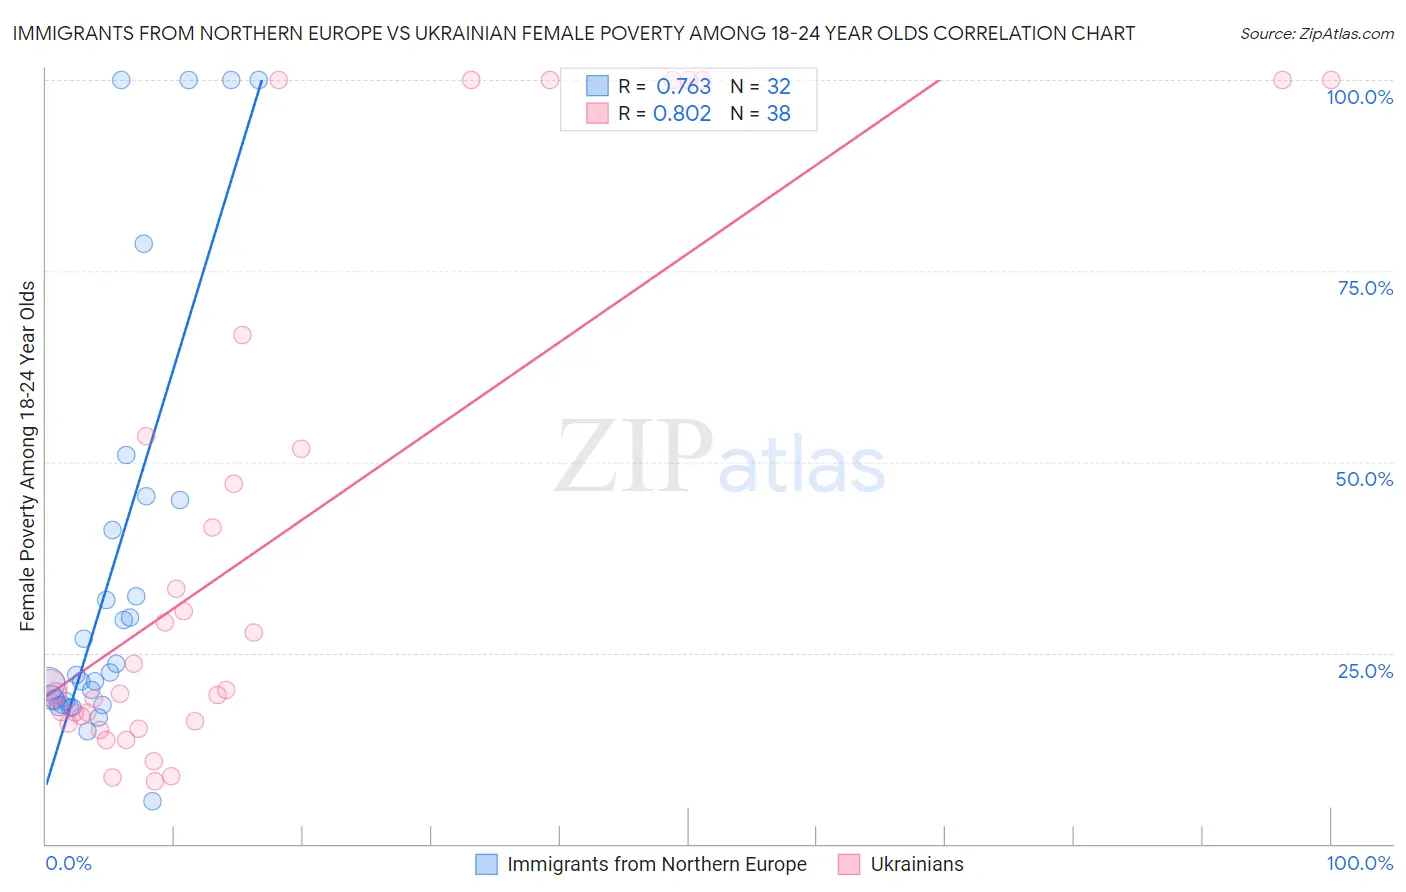
Immigrants from Northern Europe vs Ukrainian Female Poverty Among 18-24 Year Olds Correlation Chart
The statistical analysis conducted on geographies consisting of 458,376,761 people shows a strong positive correlation between the proportion of Immigrants from Northern Europe and poverty level among females between the ages 18 and 24 in the United States with a correlation coefficient (R) of 0.763 and weighted average of 19.4%. Similarly, the statistical analysis conducted on geographies consisting of 430,534,121 people shows a very strong positive correlation between the proportion of Ukrainians and poverty level among females between the ages 18 and 24 in the United States with a correlation coefficient (R) of 0.802 and weighted average of 19.0%, a difference of 1.8%.
Female Poverty Among 18-24 Year Olds Correlation Summary
| Measurement | Immigrants from Northern Europe | Ukrainian |
| Minimum | 5.6% | 8.2% |
| Maximum | 100.0% | 100.0% |
| Range | 94.4% | 91.8% |
| Mean | 35.8% | 39.9% |
| Median | 22.3% | 20.4% |
| Interquartile 25% (IQ1) | 18.4% | 16.1% |
| Interquartile 75% (IQ3) | 43.0% | 53.4% |
| Interquartile Range (IQR) | 24.6% | 37.3% |
| Standard Deviation (Sample) | 28.1% | 34.0% |
| Standard Deviation (Population) | 27.7% | 33.5% |
Similar Demographics by Female Poverty Among 18-24 Year Olds
Demographics Similar to Immigrants from Northern Europe by Female Poverty Among 18-24 Year Olds
In terms of female poverty among 18-24 year olds, the demographic groups most similar to Immigrants from Northern Europe are Guyanese (19.4%, a difference of 0.020%), Cypriot (19.3%, a difference of 0.040%), Immigrants from Guyana (19.3%, a difference of 0.060%), Immigrants from Iran (19.3%, a difference of 0.12%), and Immigrants (19.3%, a difference of 0.15%).
| Demographics | Rating | Rank | Female Poverty Among 18-24 Year Olds |
| Immigrants | Cameroon | 96.3 /100 | #113 | Exceptional 19.3% |
| Slovenes | 96.2 /100 | #114 | Exceptional 19.3% |
| Immigrants | Hungary | 96.2 /100 | #115 | Exceptional 19.3% |
| Immigrants | Immigrants | 95.9 /100 | #116 | Exceptional 19.3% |
| Immigrants | Iran | 95.8 /100 | #117 | Exceptional 19.3% |
| Immigrants | Guyana | 95.6 /100 | #118 | Exceptional 19.3% |
| Cypriots | 95.5 /100 | #119 | Exceptional 19.3% |
| Immigrants | Northern Europe | 95.4 /100 | #120 | Exceptional 19.4% |
| Guyanese | 95.3 /100 | #121 | Exceptional 19.4% |
| Cambodians | 94.6 /100 | #122 | Exceptional 19.4% |
| Paraguayans | 94.6 /100 | #123 | Exceptional 19.4% |
| Immigrants | Chile | 94.3 /100 | #124 | Exceptional 19.4% |
| Immigrants | Panama | 94.0 /100 | #125 | Exceptional 19.4% |
| Immigrants | Russia | 93.7 /100 | #126 | Exceptional 19.4% |
| Cape Verdeans | 93.6 /100 | #127 | Exceptional 19.4% |
Demographics Similar to Ukrainians by Female Poverty Among 18-24 Year Olds
In terms of female poverty among 18-24 year olds, the demographic groups most similar to Ukrainians are Haitian (19.0%, a difference of 0.060%), Guamanian/Chamorro (19.0%, a difference of 0.070%), Filipino (19.0%, a difference of 0.080%), Romanian (19.0%, a difference of 0.13%), and Sierra Leonean (19.0%, a difference of 0.17%).
| Demographics | Rating | Rank | Female Poverty Among 18-24 Year Olds |
| Immigrants | Jamaica | 99.2 /100 | #87 | Exceptional 18.9% |
| Croatians | 99.1 /100 | #88 | Exceptional 19.0% |
| Immigrants | Cabo Verde | 99.0 /100 | #89 | Exceptional 19.0% |
| Afghans | 99.0 /100 | #90 | Exceptional 19.0% |
| Romanians | 98.9 /100 | #91 | Exceptional 19.0% |
| Filipinos | 98.9 /100 | #92 | Exceptional 19.0% |
| Haitians | 98.9 /100 | #93 | Exceptional 19.0% |
| Ukrainians | 98.8 /100 | #94 | Exceptional 19.0% |
| Guamanians/Chamorros | 98.8 /100 | #95 | Exceptional 19.0% |
| Sierra Leoneans | 98.7 /100 | #96 | Exceptional 19.0% |
| Salvadorans | 98.4 /100 | #97 | Exceptional 19.1% |
| Immigrants | Jordan | 98.4 /100 | #98 | Exceptional 19.1% |
| Immigrants | Czechoslovakia | 98.3 /100 | #99 | Exceptional 19.1% |
| Chileans | 98.3 /100 | #100 | Exceptional 19.1% |
| Ecuadorians | 98.1 /100 | #101 | Exceptional 19.1% |