Immigrants from Ghana vs Ukrainian Female Poverty Among 18-24 Year Olds
COMPARE
Immigrants from Ghana
Ukrainian
Female Poverty Among 18-24 Year Olds
Female Poverty Among 18-24 Year Olds Comparison
Immigrants from Ghana
Ukrainians
20.5%
FEMALE POVERTY AMONG 18-24 YEAR OLDS
14.3/ 100
METRIC RATING
210th/ 347
METRIC RANK
19.0%
FEMALE POVERTY AMONG 18-24 YEAR OLDS
98.8/ 100
METRIC RATING
94th/ 347
METRIC RANK
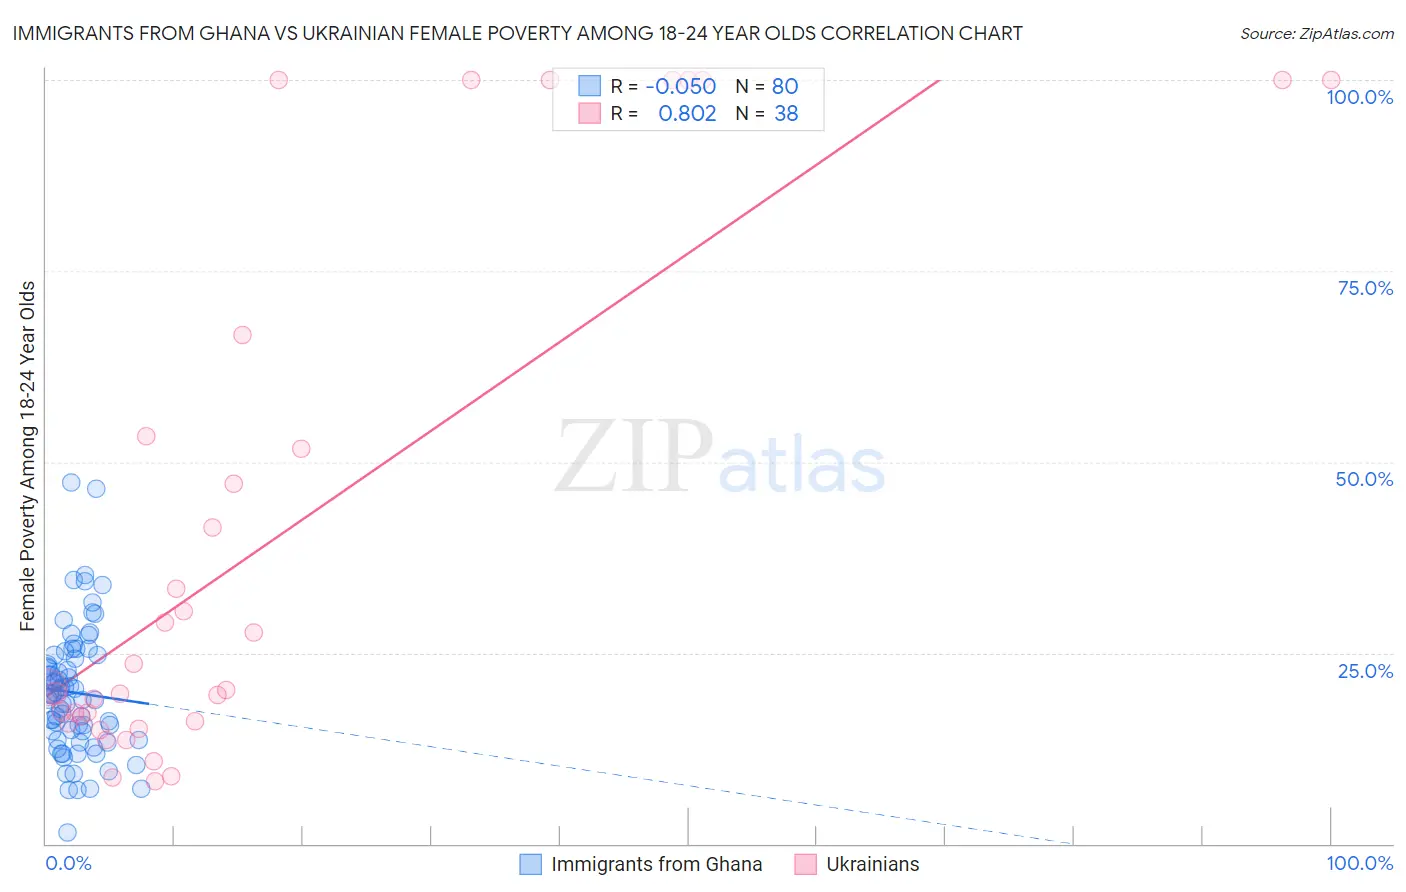
Immigrants from Ghana vs Ukrainian Female Poverty Among 18-24 Year Olds Correlation Chart
The statistical analysis conducted on geographies consisting of 197,534,703 people shows a slight negative correlation between the proportion of Immigrants from Ghana and poverty level among females between the ages 18 and 24 in the United States with a correlation coefficient (R) of -0.050 and weighted average of 20.5%. Similarly, the statistical analysis conducted on geographies consisting of 430,534,121 people shows a very strong positive correlation between the proportion of Ukrainians and poverty level among females between the ages 18 and 24 in the United States with a correlation coefficient (R) of 0.802 and weighted average of 19.0%, a difference of 8.1%.
Female Poverty Among 18-24 Year Olds Correlation Summary
| Measurement | Immigrants from Ghana | Ukrainian |
| Minimum | 1.5% | 8.2% |
| Maximum | 47.4% | 100.0% |
| Range | 45.9% | 91.8% |
| Mean | 19.8% | 39.9% |
| Median | 19.6% | 20.4% |
| Interquartile 25% (IQ1) | 14.2% | 16.1% |
| Interquartile 75% (IQ3) | 24.4% | 53.4% |
| Interquartile Range (IQR) | 10.2% | 37.3% |
| Standard Deviation (Sample) | 8.3% | 34.0% |
| Standard Deviation (Population) | 8.3% | 33.5% |
Similar Demographics by Female Poverty Among 18-24 Year Olds
Demographics Similar to Immigrants from Ghana by Female Poverty Among 18-24 Year Olds
In terms of female poverty among 18-24 year olds, the demographic groups most similar to Immigrants from Ghana are Immigrants from Western Europe (20.6%, a difference of 0.080%), Arab (20.5%, a difference of 0.11%), Dutch (20.5%, a difference of 0.15%), Spaniard (20.5%, a difference of 0.19%), and Hispanic or Latino (20.5%, a difference of 0.21%).
| Demographics | Rating | Rank | Female Poverty Among 18-24 Year Olds |
| Immigrants | Malaysia | 17.2 /100 | #203 | Poor 20.5% |
| Immigrants | Netherlands | 17.0 /100 | #204 | Poor 20.5% |
| English | 16.7 /100 | #205 | Poor 20.5% |
| Hispanics or Latinos | 16.6 /100 | #206 | Poor 20.5% |
| Spaniards | 16.3 /100 | #207 | Poor 20.5% |
| Dutch | 15.9 /100 | #208 | Poor 20.5% |
| Arabs | 15.5 /100 | #209 | Poor 20.5% |
| Immigrants | Ghana | 14.3 /100 | #210 | Poor 20.5% |
| Immigrants | Western Europe | 13.5 /100 | #211 | Poor 20.6% |
| Liberians | 11.6 /100 | #212 | Poor 20.6% |
| Northern Europeans | 11.6 /100 | #213 | Poor 20.6% |
| Immigrants | South Africa | 10.7 /100 | #214 | Poor 20.6% |
| Spanish | 10.4 /100 | #215 | Poor 20.6% |
| Immigrants | Western Africa | 10.2 /100 | #216 | Poor 20.6% |
| Immigrants | Laos | 9.7 /100 | #217 | Tragic 20.6% |
Demographics Similar to Ukrainians by Female Poverty Among 18-24 Year Olds
In terms of female poverty among 18-24 year olds, the demographic groups most similar to Ukrainians are Haitian (19.0%, a difference of 0.060%), Guamanian/Chamorro (19.0%, a difference of 0.070%), Filipino (19.0%, a difference of 0.080%), Romanian (19.0%, a difference of 0.13%), and Sierra Leonean (19.0%, a difference of 0.17%).
| Demographics | Rating | Rank | Female Poverty Among 18-24 Year Olds |
| Immigrants | Jamaica | 99.2 /100 | #87 | Exceptional 18.9% |
| Croatians | 99.1 /100 | #88 | Exceptional 19.0% |
| Immigrants | Cabo Verde | 99.0 /100 | #89 | Exceptional 19.0% |
| Afghans | 99.0 /100 | #90 | Exceptional 19.0% |
| Romanians | 98.9 /100 | #91 | Exceptional 19.0% |
| Filipinos | 98.9 /100 | #92 | Exceptional 19.0% |
| Haitians | 98.9 /100 | #93 | Exceptional 19.0% |
| Ukrainians | 98.8 /100 | #94 | Exceptional 19.0% |
| Guamanians/Chamorros | 98.8 /100 | #95 | Exceptional 19.0% |
| Sierra Leoneans | 98.7 /100 | #96 | Exceptional 19.0% |
| Salvadorans | 98.4 /100 | #97 | Exceptional 19.1% |
| Immigrants | Jordan | 98.4 /100 | #98 | Exceptional 19.1% |
| Immigrants | Czechoslovakia | 98.3 /100 | #99 | Exceptional 19.1% |
| Chileans | 98.3 /100 | #100 | Exceptional 19.1% |
| Ecuadorians | 98.1 /100 | #101 | Exceptional 19.1% |