Immigrants from Northern Europe vs Immigrants from North Macedonia Female Poverty Among 18-24 Year Olds
COMPARE
Immigrants from Northern Europe
Immigrants from North Macedonia
Female Poverty Among 18-24 Year Olds
Female Poverty Among 18-24 Year Olds Comparison
Immigrants from Northern Europe
Immigrants from North Macedonia
19.4%
FEMALE POVERTY AMONG 18-24 YEAR OLDS
95.4/ 100
METRIC RATING
120th/ 347
METRIC RANK
17.6%
FEMALE POVERTY AMONG 18-24 YEAR OLDS
100.0/ 100
METRIC RATING
23rd/ 347
METRIC RANK
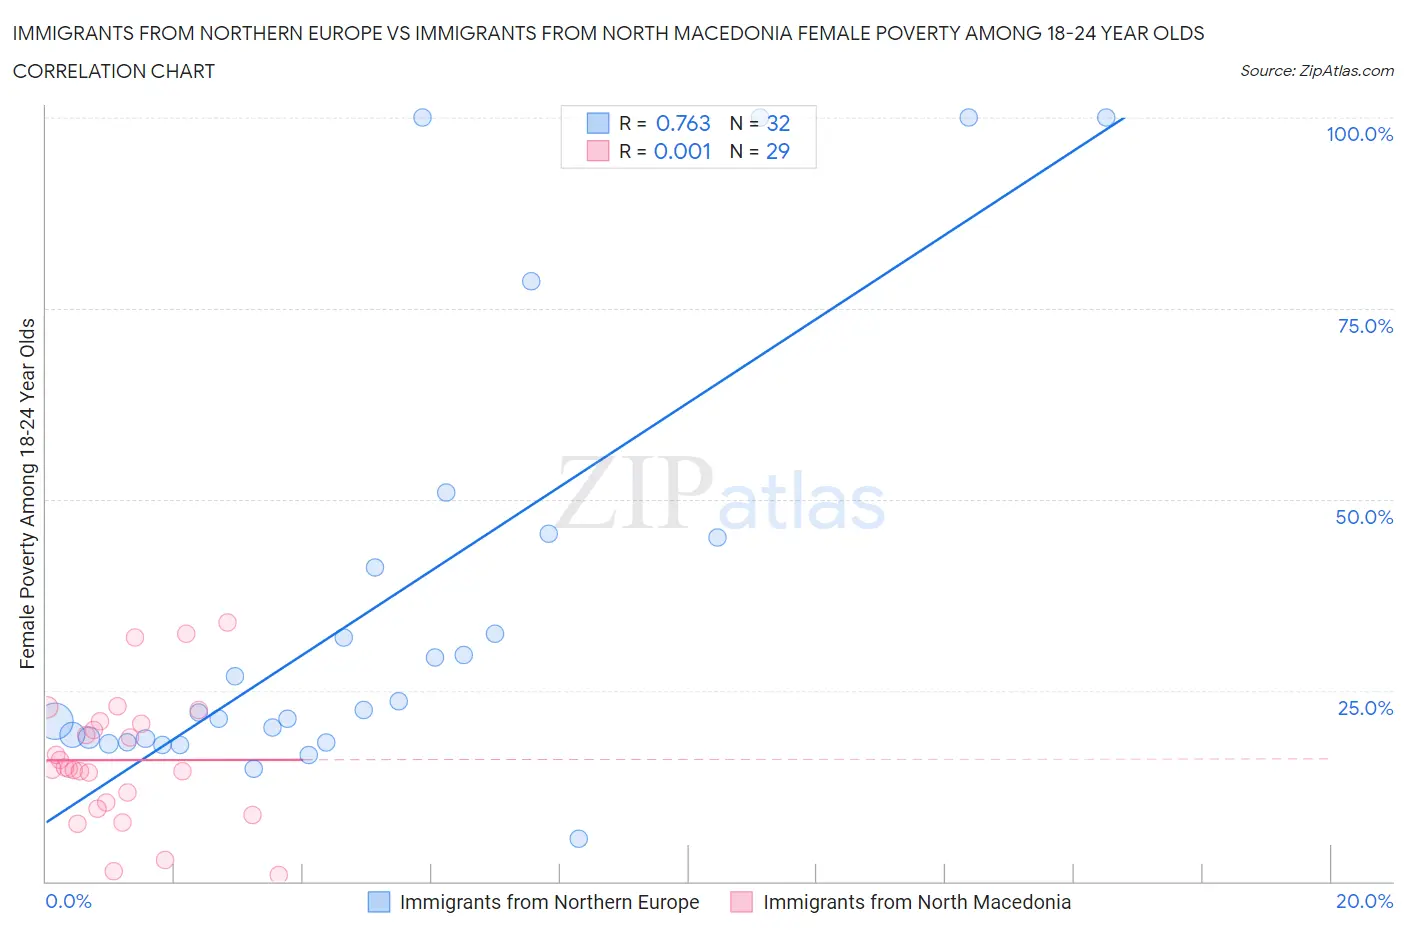
Immigrants from Northern Europe vs Immigrants from North Macedonia Female Poverty Among 18-24 Year Olds Correlation Chart
The statistical analysis conducted on geographies consisting of 458,376,761 people shows a strong positive correlation between the proportion of Immigrants from Northern Europe and poverty level among females between the ages 18 and 24 in the United States with a correlation coefficient (R) of 0.763 and weighted average of 19.4%. Similarly, the statistical analysis conducted on geographies consisting of 73,458,118 people shows no correlation between the proportion of Immigrants from North Macedonia and poverty level among females between the ages 18 and 24 in the United States with a correlation coefficient (R) of 0.001 and weighted average of 17.6%, a difference of 10.3%.
Female Poverty Among 18-24 Year Olds Correlation Summary
| Measurement | Immigrants from Northern Europe | Immigrants from North Macedonia |
| Minimum | 5.6% | 0.76% |
| Maximum | 100.0% | 33.9% |
| Range | 94.4% | 33.1% |
| Mean | 35.8% | 15.9% |
| Median | 22.3% | 14.7% |
| Interquartile 25% (IQ1) | 18.4% | 9.9% |
| Interquartile 75% (IQ3) | 43.0% | 20.8% |
| Interquartile Range (IQR) | 24.6% | 10.9% |
| Standard Deviation (Sample) | 28.1% | 8.4% |
| Standard Deviation (Population) | 27.7% | 8.3% |
Similar Demographics by Female Poverty Among 18-24 Year Olds
Demographics Similar to Immigrants from Northern Europe by Female Poverty Among 18-24 Year Olds
In terms of female poverty among 18-24 year olds, the demographic groups most similar to Immigrants from Northern Europe are Guyanese (19.4%, a difference of 0.020%), Cypriot (19.3%, a difference of 0.040%), Immigrants from Guyana (19.3%, a difference of 0.060%), Immigrants from Iran (19.3%, a difference of 0.12%), and Immigrants (19.3%, a difference of 0.15%).
| Demographics | Rating | Rank | Female Poverty Among 18-24 Year Olds |
| Immigrants | Cameroon | 96.3 /100 | #113 | Exceptional 19.3% |
| Slovenes | 96.2 /100 | #114 | Exceptional 19.3% |
| Immigrants | Hungary | 96.2 /100 | #115 | Exceptional 19.3% |
| Immigrants | Immigrants | 95.9 /100 | #116 | Exceptional 19.3% |
| Immigrants | Iran | 95.8 /100 | #117 | Exceptional 19.3% |
| Immigrants | Guyana | 95.6 /100 | #118 | Exceptional 19.3% |
| Cypriots | 95.5 /100 | #119 | Exceptional 19.3% |
| Immigrants | Northern Europe | 95.4 /100 | #120 | Exceptional 19.4% |
| Guyanese | 95.3 /100 | #121 | Exceptional 19.4% |
| Cambodians | 94.6 /100 | #122 | Exceptional 19.4% |
| Paraguayans | 94.6 /100 | #123 | Exceptional 19.4% |
| Immigrants | Chile | 94.3 /100 | #124 | Exceptional 19.4% |
| Immigrants | Panama | 94.0 /100 | #125 | Exceptional 19.4% |
| Immigrants | Russia | 93.7 /100 | #126 | Exceptional 19.4% |
| Cape Verdeans | 93.6 /100 | #127 | Exceptional 19.4% |
Demographics Similar to Immigrants from North Macedonia by Female Poverty Among 18-24 Year Olds
In terms of female poverty among 18-24 year olds, the demographic groups most similar to Immigrants from North Macedonia are Maltese (17.6%, a difference of 0.060%), Immigrants from South Central Asia (17.6%, a difference of 0.25%), Immigrants from Hong Kong (17.5%, a difference of 0.56%), Immigrants from Fiji (17.7%, a difference of 0.57%), and Immigrants from Venezuela (17.4%, a difference of 0.67%).
| Demographics | Rating | Rank | Female Poverty Among 18-24 Year Olds |
| Peruvians | 100.0 /100 | #16 | Exceptional 17.2% |
| Immigrants | Taiwan | 100.0 /100 | #17 | Exceptional 17.3% |
| Immigrants | Colombia | 100.0 /100 | #18 | Exceptional 17.3% |
| Immigrants | Lithuania | 100.0 /100 | #19 | Exceptional 17.4% |
| Immigrants | Venezuela | 100.0 /100 | #20 | Exceptional 17.4% |
| Bolivians | 100.0 /100 | #21 | Exceptional 17.4% |
| Immigrants | Hong Kong | 100.0 /100 | #22 | Exceptional 17.5% |
| Immigrants | North Macedonia | 100.0 /100 | #23 | Exceptional 17.6% |
| Maltese | 100.0 /100 | #24 | Exceptional 17.6% |
| Immigrants | South Central Asia | 100.0 /100 | #25 | Exceptional 17.6% |
| Immigrants | Fiji | 100.0 /100 | #26 | Exceptional 17.7% |
| Colombians | 100.0 /100 | #27 | Exceptional 17.7% |
| Venezuelans | 100.0 /100 | #28 | Exceptional 17.7% |
| Portuguese | 100.0 /100 | #29 | Exceptional 17.8% |
| Immigrants | South Eastern Asia | 100.0 /100 | #30 | Exceptional 17.8% |