Immigrants from Northern Europe vs Ukrainian Unemployment Among Ages 55 to 59 years
COMPARE
Immigrants from Northern Europe
Ukrainian
Unemployment Among Ages 55 to 59 years
Unemployment Among Ages 55 to 59 years Comparison
Immigrants from Northern Europe
Ukrainians
4.8%
UNEMPLOYMENT AMONG AGES 55 TO 59 YEARS
77.5/ 100
METRIC RATING
145th/ 347
METRIC RANK
4.8%
UNEMPLOYMENT AMONG AGES 55 TO 59 YEARS
78.6/ 100
METRIC RATING
143rd/ 347
METRIC RANK
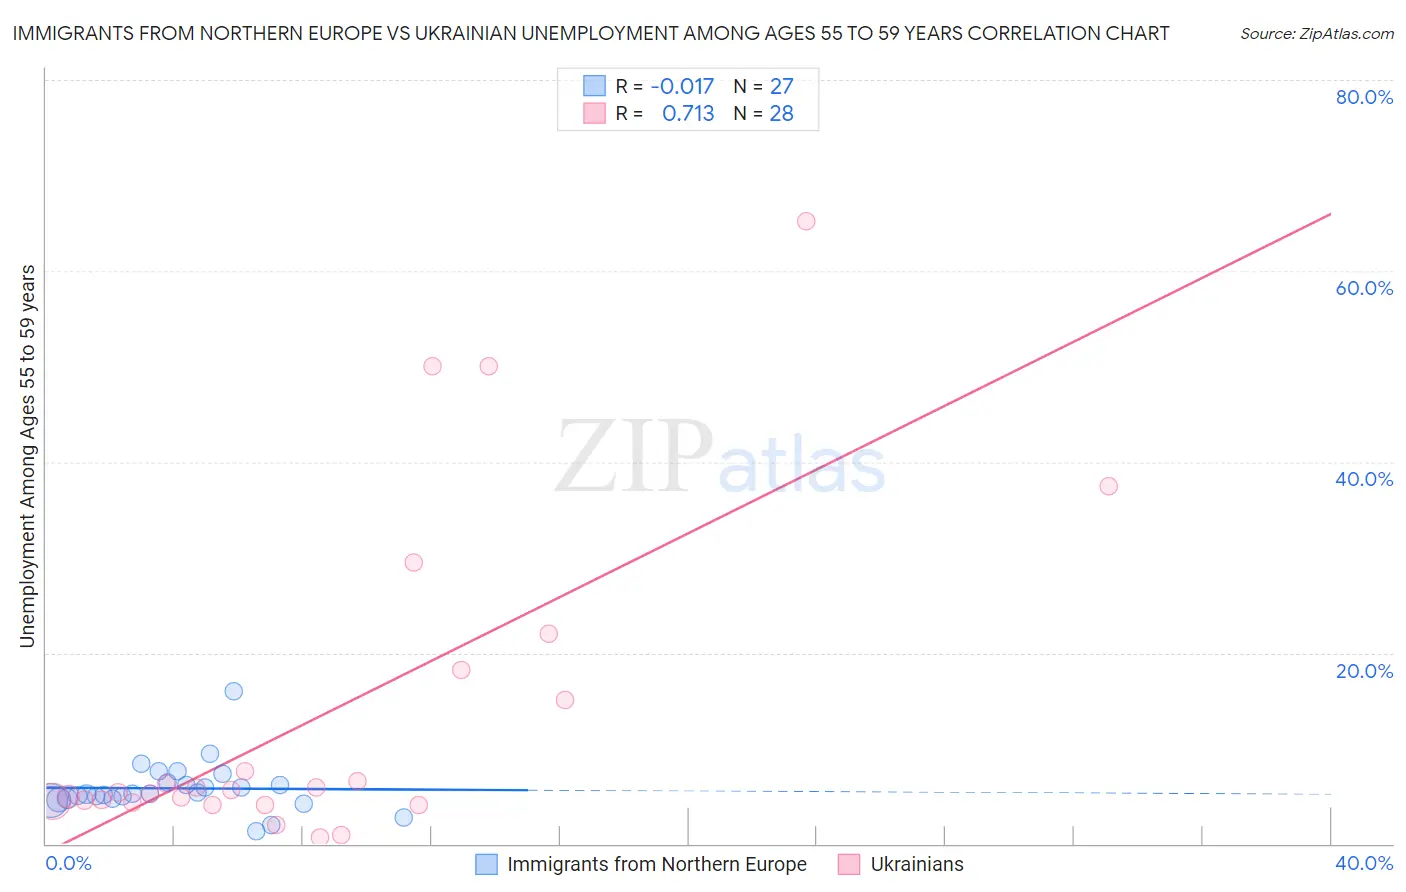
Immigrants from Northern Europe vs Ukrainian Unemployment Among Ages 55 to 59 years Correlation Chart
The statistical analysis conducted on geographies consisting of 432,535,263 people shows no correlation between the proportion of Immigrants from Northern Europe and unemployment rate among population between the ages 55 and 59 in the United States with a correlation coefficient (R) of -0.017 and weighted average of 4.8%. Similarly, the statistical analysis conducted on geographies consisting of 408,753,235 people shows a strong positive correlation between the proportion of Ukrainians and unemployment rate among population between the ages 55 and 59 in the United States with a correlation coefficient (R) of 0.713 and weighted average of 4.8%, a difference of 0.060%.
Unemployment Among Ages 55 to 59 years Correlation Summary
| Measurement | Immigrants from Northern Europe | Ukrainian |
| Minimum | 1.3% | 0.61% |
| Maximum | 15.9% | 65.2% |
| Range | 14.6% | 64.6% |
| Mean | 5.8% | 13.5% |
| Median | 5.2% | 5.5% |
| Interquartile 25% (IQ1) | 4.7% | 4.4% |
| Interquartile 75% (IQ3) | 6.4% | 16.6% |
| Interquartile Range (IQR) | 1.7% | 12.2% |
| Standard Deviation (Sample) | 2.7% | 17.1% |
| Standard Deviation (Population) | 2.6% | 16.8% |
Demographics Similar to Immigrants from Northern Europe and Ukrainians by Unemployment Among Ages 55 to 59 years
In terms of unemployment among ages 55 to 59 years, the demographic groups most similar to Immigrants from Northern Europe are Immigrants from South Eastern Asia (4.8%, a difference of 0.010%), Immigrants from Asia (4.8%, a difference of 0.020%), Immigrants from Singapore (4.8%, a difference of 0.060%), Immigrants from Norway (4.8%, a difference of 0.14%), and French Canadian (4.8%, a difference of 0.16%). Similarly, the demographic groups most similar to Ukrainians are Immigrants from Asia (4.8%, a difference of 0.050%), Immigrants from Norway (4.8%, a difference of 0.070%), Immigrants from South Eastern Asia (4.8%, a difference of 0.070%), French Canadian (4.8%, a difference of 0.090%), and Immigrants from Indonesia (4.8%, a difference of 0.10%).
| Demographics | Rating | Rank | Unemployment Among Ages 55 to 59 years |
| Panamanians | 84.1 /100 | #134 | Excellent 4.7% |
| Slavs | 83.7 /100 | #135 | Excellent 4.7% |
| Colombians | 83.6 /100 | #136 | Excellent 4.7% |
| Delaware | 83.6 /100 | #137 | Excellent 4.7% |
| Immigrants | Switzerland | 82.9 /100 | #138 | Excellent 4.7% |
| Romanians | 82.7 /100 | #139 | Excellent 4.7% |
| Immigrants | Indonesia | 80.2 /100 | #140 | Excellent 4.8% |
| French Canadians | 80.1 /100 | #141 | Excellent 4.8% |
| Immigrants | Norway | 79.8 /100 | #142 | Good 4.8% |
| Ukrainians | 78.6 /100 | #143 | Good 4.8% |
| Immigrants | Asia | 77.8 /100 | #144 | Good 4.8% |
| Immigrants | Northern Europe | 77.5 /100 | #145 | Good 4.8% |
| Immigrants | South Eastern Asia | 77.4 /100 | #146 | Good 4.8% |
| Immigrants | Singapore | 76.6 /100 | #147 | Good 4.8% |
| Immigrants | Bahamas | 71.8 /100 | #148 | Good 4.8% |
| Immigrants | Lithuania | 70.8 /100 | #149 | Good 4.8% |
| Immigrants | Northern Africa | 69.8 /100 | #150 | Good 4.8% |
| Bahamians | 68.6 /100 | #151 | Good 4.8% |
| Laotians | 68.2 /100 | #152 | Good 4.8% |
| Immigrants | Uruguay | 67.2 /100 | #153 | Good 4.8% |
| Immigrants | Panama | 66.8 /100 | #154 | Good 4.8% |