Immigrants from North America vs Immigrants from Switzerland Female Poverty Among 18-24 Year Olds
COMPARE
Immigrants from North America
Immigrants from Switzerland
Female Poverty Among 18-24 Year Olds
Female Poverty Among 18-24 Year Olds Comparison
Immigrants from North America
Immigrants from Switzerland
19.5%
FEMALE POVERTY AMONG 18-24 YEAR OLDS
92.1/ 100
METRIC RATING
134th/ 347
METRIC RANK
21.8%
FEMALE POVERTY AMONG 18-24 YEAR OLDS
0.1/ 100
METRIC RATING
277th/ 347
METRIC RANK
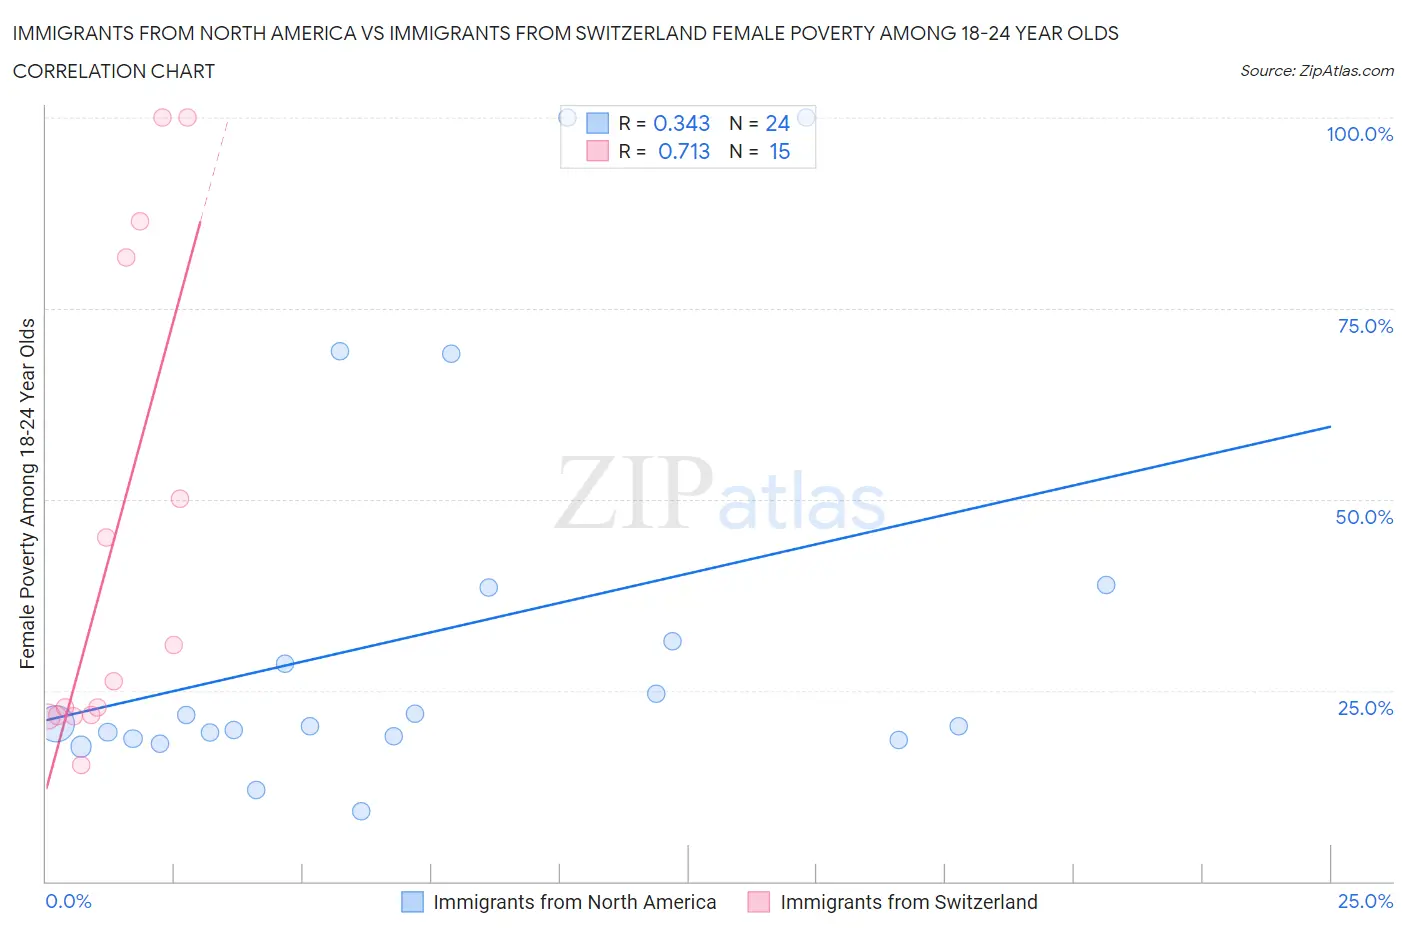
Immigrants from North America vs Immigrants from Switzerland Female Poverty Among 18-24 Year Olds Correlation Chart
The statistical analysis conducted on geographies consisting of 445,818,152 people shows a mild positive correlation between the proportion of Immigrants from North America and poverty level among females between the ages 18 and 24 in the United States with a correlation coefficient (R) of 0.343 and weighted average of 19.5%. Similarly, the statistical analysis conducted on geographies consisting of 145,929,420 people shows a strong positive correlation between the proportion of Immigrants from Switzerland and poverty level among females between the ages 18 and 24 in the United States with a correlation coefficient (R) of 0.713 and weighted average of 21.8%, a difference of 11.9%.
Female Poverty Among 18-24 Year Olds Correlation Summary
| Measurement | Immigrants from North America | Immigrants from Switzerland |
| Minimum | 9.1% | 15.3% |
| Maximum | 100.0% | 100.0% |
| Range | 90.9% | 84.7% |
| Mean | 32.3% | 44.5% |
| Median | 20.5% | 26.2% |
| Interquartile 25% (IQ1) | 18.8% | 21.7% |
| Interquartile 75% (IQ3) | 34.9% | 81.7% |
| Interquartile Range (IQR) | 16.1% | 59.9% |
| Standard Deviation (Sample) | 25.6% | 31.3% |
| Standard Deviation (Population) | 25.1% | 30.3% |
Similar Demographics by Female Poverty Among 18-24 Year Olds
Demographics Similar to Immigrants from North America by Female Poverty Among 18-24 Year Olds
In terms of female poverty among 18-24 year olds, the demographic groups most similar to Immigrants from North America are Jamaican (19.5%, a difference of 0.010%), Turkish (19.5%, a difference of 0.010%), Soviet Union (19.5%, a difference of 0.010%), Latvian (19.5%, a difference of 0.11%), and Russian (19.5%, a difference of 0.11%).
| Demographics | Rating | Rank | Female Poverty Among 18-24 Year Olds |
| Cape Verdeans | 93.6 /100 | #127 | Exceptional 19.4% |
| Slovaks | 92.9 /100 | #128 | Exceptional 19.5% |
| Immigrants | England | 92.9 /100 | #129 | Exceptional 19.5% |
| Immigrants | Canada | 92.9 /100 | #130 | Exceptional 19.5% |
| Latvians | 92.7 /100 | #131 | Exceptional 19.5% |
| Jamaicans | 92.1 /100 | #132 | Exceptional 19.5% |
| Turks | 92.1 /100 | #133 | Exceptional 19.5% |
| Immigrants | North America | 92.1 /100 | #134 | Exceptional 19.5% |
| Soviet Union | 92.0 /100 | #135 | Exceptional 19.5% |
| Russians | 91.5 /100 | #136 | Exceptional 19.5% |
| Austrians | 90.7 /100 | #137 | Exceptional 19.5% |
| Immigrants | Morocco | 89.9 /100 | #138 | Excellent 19.6% |
| Indians (Asian) | 88.3 /100 | #139 | Excellent 19.6% |
| Immigrants | Trinidad and Tobago | 85.6 /100 | #140 | Excellent 19.7% |
| Pennsylvania Germans | 85.5 /100 | #141 | Excellent 19.7% |
Demographics Similar to Immigrants from Switzerland by Female Poverty Among 18-24 Year Olds
In terms of female poverty among 18-24 year olds, the demographic groups most similar to Immigrants from Switzerland are Bahamian (21.8%, a difference of 0.13%), Immigrants from Bangladesh (21.8%, a difference of 0.15%), Immigrants from Honduras (21.8%, a difference of 0.19%), Yaqui (21.9%, a difference of 0.26%), and Spanish American (21.9%, a difference of 0.43%).
| Demographics | Rating | Rank | Female Poverty Among 18-24 Year Olds |
| Mongolians | 0.2 /100 | #270 | Tragic 21.6% |
| Scotch-Irish | 0.2 /100 | #271 | Tragic 21.6% |
| Basques | 0.2 /100 | #272 | Tragic 21.7% |
| New Zealanders | 0.2 /100 | #273 | Tragic 21.7% |
| Immigrants | Honduras | 0.1 /100 | #274 | Tragic 21.8% |
| Immigrants | Bangladesh | 0.1 /100 | #275 | Tragic 21.8% |
| Bahamians | 0.1 /100 | #276 | Tragic 21.8% |
| Immigrants | Switzerland | 0.1 /100 | #277 | Tragic 21.8% |
| Yaqui | 0.1 /100 | #278 | Tragic 21.9% |
| Spanish Americans | 0.1 /100 | #279 | Tragic 21.9% |
| Immigrants | Dominica | 0.1 /100 | #280 | Tragic 21.9% |
| Immigrants | Dominican Republic | 0.1 /100 | #281 | Tragic 21.9% |
| Bermudans | 0.1 /100 | #282 | Tragic 21.9% |
| Sub-Saharan Africans | 0.0 /100 | #283 | Tragic 22.0% |
| Tlingit-Haida | 0.0 /100 | #284 | Tragic 22.0% |