Immigrants from North America vs Immigrants from Switzerland 1st Grade
COMPARE
Immigrants from North America
Immigrants from Switzerland
1st Grade
1st Grade Comparison
Immigrants from North America
Immigrants from Switzerland
98.4%
1ST GRADE
99.7/ 100
METRIC RATING
63rd/ 347
METRIC RANK
98.2%
1ST GRADE
97.3/ 100
METRIC RATING
107th/ 347
METRIC RANK
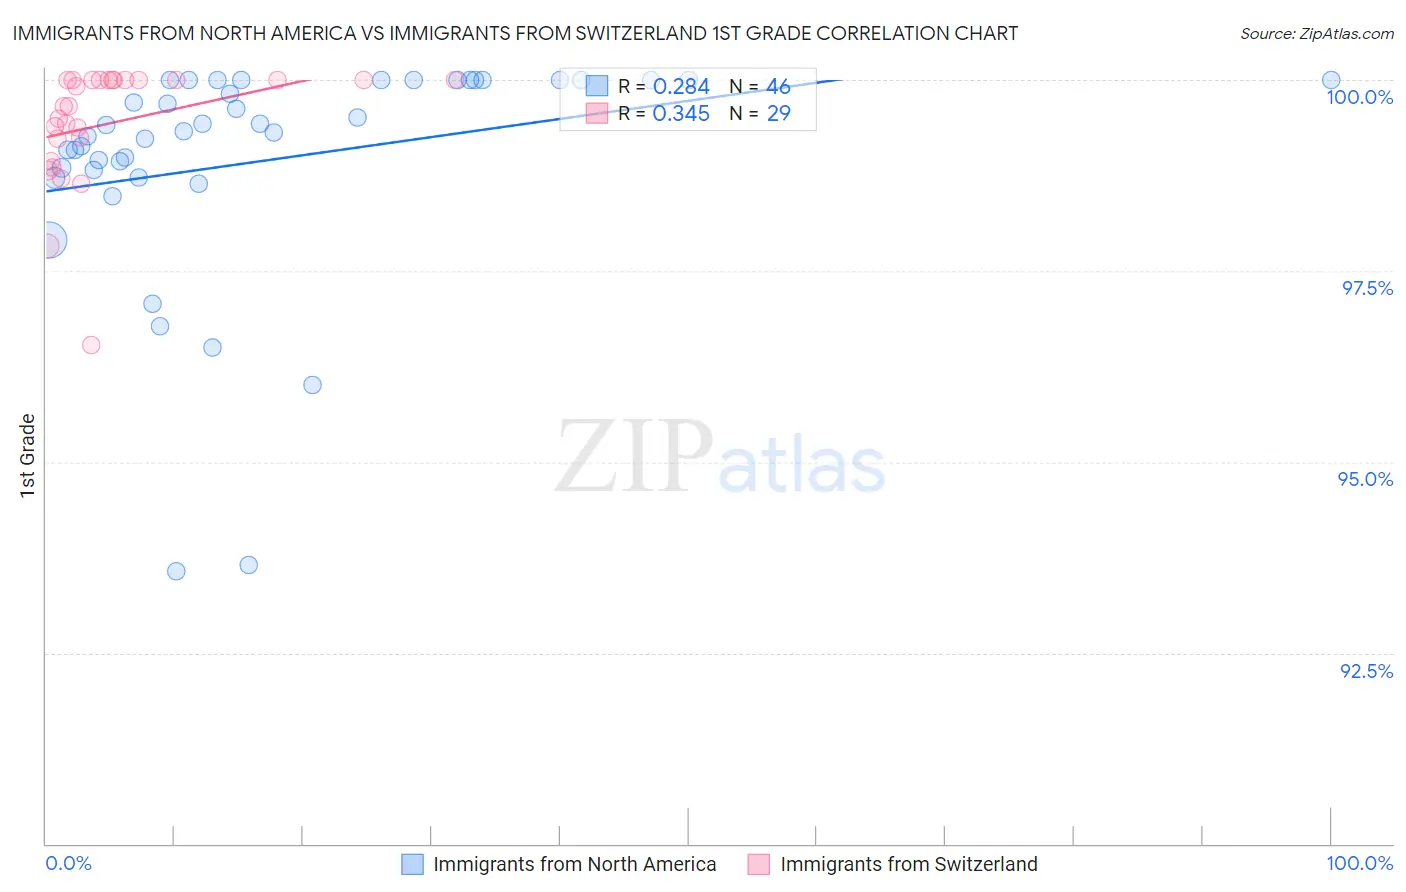
Immigrants from North America vs Immigrants from Switzerland 1st Grade Correlation Chart
The statistical analysis conducted on geographies consisting of 462,462,400 people shows a weak positive correlation between the proportion of Immigrants from North America and percentage of population with at least 1st grade education in the United States with a correlation coefficient (R) of 0.284 and weighted average of 98.4%. Similarly, the statistical analysis conducted on geographies consisting of 148,082,451 people shows a mild positive correlation between the proportion of Immigrants from Switzerland and percentage of population with at least 1st grade education in the United States with a correlation coefficient (R) of 0.345 and weighted average of 98.2%, a difference of 0.18%.
1st Grade Correlation Summary
| Measurement | Immigrants from North America | Immigrants from Switzerland |
| Minimum | 93.6% | 96.5% |
| Maximum | 100.0% | 100.0% |
| Range | 6.4% | 3.5% |
| Mean | 98.9% | 99.4% |
| Median | 99.4% | 99.7% |
| Interquartile 25% (IQ1) | 98.8% | 99.1% |
| Interquartile 75% (IQ3) | 100.0% | 100.0% |
| Interquartile Range (IQR) | 1.2% | 0.91% |
| Standard Deviation (Sample) | 1.5% | 0.79% |
| Standard Deviation (Population) | 1.5% | 0.78% |
Similar Demographics by 1st Grade
Demographics Similar to Immigrants from North America by 1st Grade
In terms of 1st grade, the demographic groups most similar to Immigrants from North America are Creek (98.4%, a difference of 0.0%), Immigrants from Canada (98.4%, a difference of 0.0%), Bulgarian (98.4%, a difference of 0.0%), Slavic (98.4%, a difference of 0.0%), and Greek (98.4%, a difference of 0.0%).
| Demographics | Rating | Rank | 1st Grade |
| Americans | 99.8 /100 | #56 | Exceptional 98.4% |
| Austrians | 99.8 /100 | #57 | Exceptional 98.4% |
| New Zealanders | 99.7 /100 | #58 | Exceptional 98.4% |
| Creek | 99.7 /100 | #59 | Exceptional 98.4% |
| Immigrants | Canada | 99.7 /100 | #60 | Exceptional 98.4% |
| Bulgarians | 99.7 /100 | #61 | Exceptional 98.4% |
| Slavs | 99.7 /100 | #62 | Exceptional 98.4% |
| Immigrants | North America | 99.7 /100 | #63 | Exceptional 98.4% |
| Greeks | 99.7 /100 | #64 | Exceptional 98.4% |
| Maltese | 99.7 /100 | #65 | Exceptional 98.4% |
| Canadians | 99.6 /100 | #66 | Exceptional 98.3% |
| Immigrants | Austria | 99.6 /100 | #67 | Exceptional 98.3% |
| Immigrants | Northern Europe | 99.6 /100 | #68 | Exceptional 98.3% |
| Chickasaw | 99.6 /100 | #69 | Exceptional 98.3% |
| Russians | 99.6 /100 | #70 | Exceptional 98.3% |
Demographics Similar to Immigrants from Switzerland by 1st Grade
In terms of 1st grade, the demographic groups most similar to Immigrants from Switzerland are Basque (98.2%, a difference of 0.0%), Turkish (98.2%, a difference of 0.0%), Bhutanese (98.2%, a difference of 0.0%), German Russian (98.2%, a difference of 0.0%), and Immigrants from Ireland (98.2%, a difference of 0.010%).
| Demographics | Rating | Rank | 1st Grade |
| Colville | 98.0 /100 | #100 | Exceptional 98.2% |
| Romanians | 97.8 /100 | #101 | Exceptional 98.2% |
| Cree | 97.8 /100 | #102 | Exceptional 98.2% |
| Immigrants | Ireland | 97.7 /100 | #103 | Exceptional 98.2% |
| Pima | 97.5 /100 | #104 | Exceptional 98.2% |
| Basques | 97.4 /100 | #105 | Exceptional 98.2% |
| Turks | 97.4 /100 | #106 | Exceptional 98.2% |
| Immigrants | Switzerland | 97.3 /100 | #107 | Exceptional 98.2% |
| Bhutanese | 97.3 /100 | #108 | Exceptional 98.2% |
| German Russians | 97.1 /100 | #109 | Exceptional 98.2% |
| Immigrants | Singapore | 96.7 /100 | #110 | Exceptional 98.2% |
| Immigrants | Czechoslovakia | 96.6 /100 | #111 | Exceptional 98.2% |
| Immigrants | Norway | 96.6 /100 | #112 | Exceptional 98.2% |
| Immigrants | Latvia | 96.4 /100 | #113 | Exceptional 98.2% |
| Ute | 96.2 /100 | #114 | Exceptional 98.2% |