Immigrants from North America vs Immigrants from Switzerland Female Poverty Among 25-34 Year Olds
COMPARE
Immigrants from North America
Immigrants from Switzerland
Female Poverty Among 25-34 Year Olds
Female Poverty Among 25-34 Year Olds Comparison
Immigrants from North America
Immigrants from Switzerland
12.9%
FEMALE POVERTY AMONG 25-34 YEAR OLDS
89.7/ 100
METRIC RATING
129th/ 347
METRIC RANK
12.7%
FEMALE POVERTY AMONG 25-34 YEAR OLDS
95.7/ 100
METRIC RATING
101st/ 347
METRIC RANK
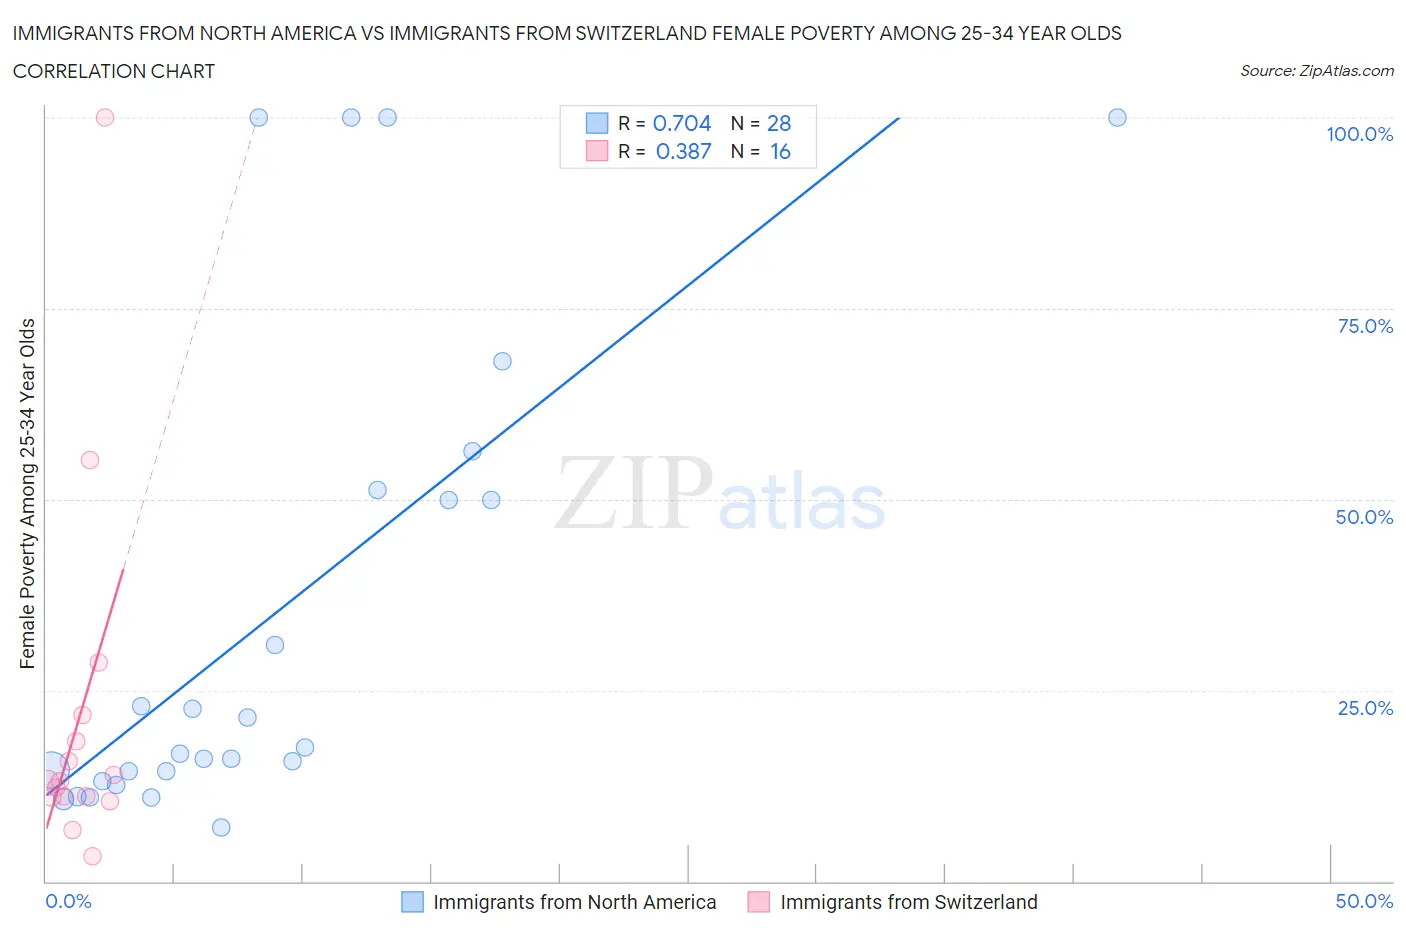
Immigrants from North America vs Immigrants from Switzerland Female Poverty Among 25-34 Year Olds Correlation Chart
The statistical analysis conducted on geographies consisting of 451,227,492 people shows a strong positive correlation between the proportion of Immigrants from North America and poverty level among females between the ages 25 and 34 in the United States with a correlation coefficient (R) of 0.704 and weighted average of 12.9%. Similarly, the statistical analysis conducted on geographies consisting of 146,632,859 people shows a mild positive correlation between the proportion of Immigrants from Switzerland and poverty level among females between the ages 25 and 34 in the United States with a correlation coefficient (R) of 0.387 and weighted average of 12.7%, a difference of 2.1%.
Female Poverty Among 25-34 Year Olds Correlation Summary
| Measurement | Immigrants from North America | Immigrants from Switzerland |
| Minimum | 7.1% | 3.3% |
| Maximum | 100.0% | 100.0% |
| Range | 92.9% | 96.7% |
| Mean | 34.8% | 21.6% |
| Median | 17.1% | 13.0% |
| Interquartile 25% (IQ1) | 13.7% | 11.0% |
| Interquartile 75% (IQ3) | 50.6% | 20.0% |
| Interquartile Range (IQR) | 36.9% | 9.0% |
| Standard Deviation (Sample) | 31.5% | 24.1% |
| Standard Deviation (Population) | 30.9% | 23.3% |
Similar Demographics by Female Poverty Among 25-34 Year Olds
Demographics Similar to Immigrants from North America by Female Poverty Among 25-34 Year Olds
In terms of female poverty among 25-34 year olds, the demographic groups most similar to Immigrants from North America are Immigrants from Uzbekistan (12.9%, a difference of 0.030%), Syrian (12.9%, a difference of 0.12%), Czech (12.9%, a difference of 0.13%), Pakistani (13.0%, a difference of 0.30%), and Immigrants from Hungary (13.0%, a difference of 0.32%).
| Demographics | Rating | Rank | Female Poverty Among 25-34 Year Olds |
| Immigrants | Western Asia | 92.7 /100 | #122 | Exceptional 12.8% |
| Slovenes | 92.7 /100 | #123 | Exceptional 12.8% |
| Immigrants | Netherlands | 92.0 /100 | #124 | Exceptional 12.8% |
| Immigrants | Canada | 91.5 /100 | #125 | Exceptional 12.9% |
| Immigrants | Fiji | 91.2 /100 | #126 | Exceptional 12.9% |
| Czechs | 90.3 /100 | #127 | Exceptional 12.9% |
| Syrians | 90.2 /100 | #128 | Exceptional 12.9% |
| Immigrants | North America | 89.7 /100 | #129 | Excellent 12.9% |
| Immigrants | Uzbekistan | 89.6 /100 | #130 | Excellent 12.9% |
| Pakistanis | 88.4 /100 | #131 | Excellent 13.0% |
| Immigrants | Hungary | 88.3 /100 | #132 | Excellent 13.0% |
| Serbians | 87.6 /100 | #133 | Excellent 13.0% |
| Afghans | 85.8 /100 | #134 | Excellent 13.0% |
| South Africans | 85.7 /100 | #135 | Excellent 13.0% |
| Immigrants | England | 85.5 /100 | #136 | Excellent 13.0% |
Demographics Similar to Immigrants from Switzerland by Female Poverty Among 25-34 Year Olds
In terms of female poverty among 25-34 year olds, the demographic groups most similar to Immigrants from Switzerland are Immigrants from Denmark (12.7%, a difference of 0.020%), Peruvian (12.7%, a difference of 0.060%), Immigrants from Spain (12.7%, a difference of 0.12%), Swedish (12.7%, a difference of 0.17%), and Immigrants from South Africa (12.7%, a difference of 0.22%).
| Demographics | Rating | Rank | Female Poverty Among 25-34 Year Olds |
| Immigrants | France | 96.8 /100 | #94 | Exceptional 12.6% |
| Ukrainians | 96.7 /100 | #95 | Exceptional 12.6% |
| Immigrants | Zimbabwe | 96.7 /100 | #96 | Exceptional 12.6% |
| Immigrants | Northern Africa | 96.6 /100 | #97 | Exceptional 12.6% |
| Immigrants | Ethiopia | 96.5 /100 | #98 | Exceptional 12.6% |
| Immigrants | Argentina | 96.4 /100 | #99 | Exceptional 12.6% |
| Immigrants | Denmark | 95.7 /100 | #100 | Exceptional 12.7% |
| Immigrants | Switzerland | 95.7 /100 | #101 | Exceptional 12.7% |
| Peruvians | 95.6 /100 | #102 | Exceptional 12.7% |
| Immigrants | Spain | 95.5 /100 | #103 | Exceptional 12.7% |
| Swedes | 95.4 /100 | #104 | Exceptional 12.7% |
| Immigrants | South Africa | 95.3 /100 | #105 | Exceptional 12.7% |
| Tsimshian | 95.1 /100 | #106 | Exceptional 12.7% |
| Poles | 94.9 /100 | #107 | Exceptional 12.7% |
| Immigrants | Norway | 94.4 /100 | #108 | Exceptional 12.7% |