Immigrants from Honduras vs Immigrants from Latin America Child Poverty Under the Age of 16
COMPARE
Immigrants from Honduras
Immigrants from Latin America
Child Poverty Under the Age of 16
Child Poverty Under the Age of 16 Comparison
Immigrants from Honduras
Immigrants from Latin America
22.7%
CHILD POVERTY UNDER THE AGE OF 16
0.0/ 100
METRIC RATING
326th/ 347
METRIC RANK
20.5%
CHILD POVERTY UNDER THE AGE OF 16
0.0/ 100
METRIC RATING
292nd/ 347
METRIC RANK
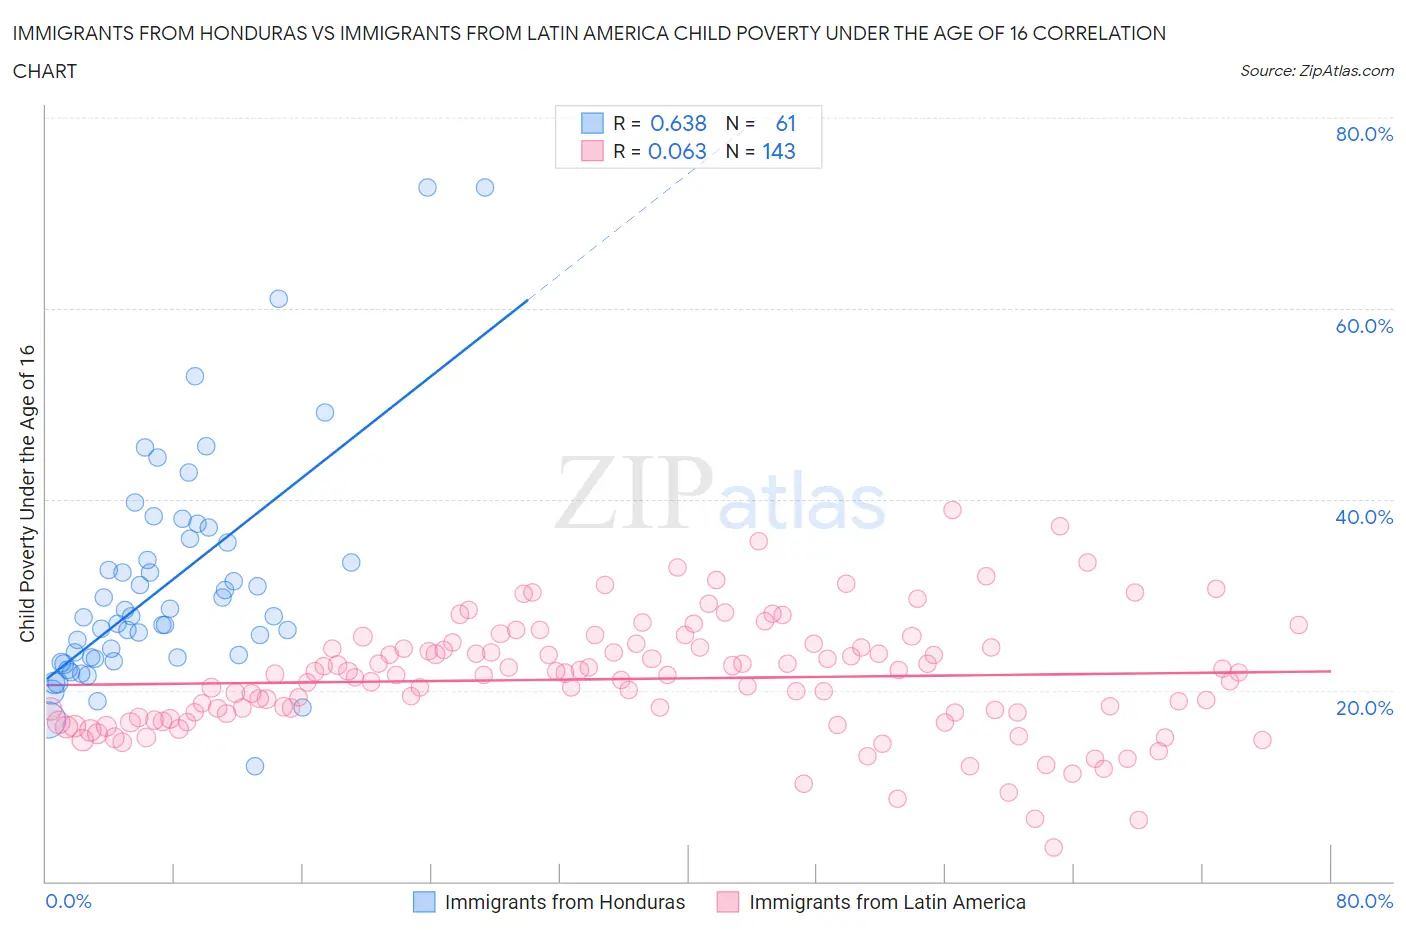
Immigrants from Honduras vs Immigrants from Latin America Child Poverty Under the Age of 16 Correlation Chart
The statistical analysis conducted on geographies consisting of 321,492,241 people shows a significant positive correlation between the proportion of Immigrants from Honduras and poverty level among children under the age of 16 in the United States with a correlation coefficient (R) of 0.638 and weighted average of 22.7%. Similarly, the statistical analysis conducted on geographies consisting of 548,259,173 people shows a slight positive correlation between the proportion of Immigrants from Latin America and poverty level among children under the age of 16 in the United States with a correlation coefficient (R) of 0.063 and weighted average of 20.5%, a difference of 10.6%.
Child Poverty Under the Age of 16 Correlation Summary
| Measurement | Immigrants from Honduras | Immigrants from Latin America |
| Minimum | 12.0% | 3.5% |
| Maximum | 72.7% | 38.9% |
| Range | 60.7% | 35.4% |
| Mean | 31.1% | 21.2% |
| Median | 27.7% | 21.6% |
| Interquartile 25% (IQ1) | 23.4% | 17.0% |
| Interquartile 75% (IQ3) | 35.7% | 24.4% |
| Interquartile Range (IQR) | 12.3% | 7.4% |
| Standard Deviation (Sample) | 11.9% | 6.1% |
| Standard Deviation (Population) | 11.8% | 6.1% |
Similar Demographics by Child Poverty Under the Age of 16
Demographics Similar to Immigrants from Honduras by Child Poverty Under the Age of 16
In terms of child poverty under the age of 16, the demographic groups most similar to Immigrants from Honduras are Immigrants from Congo (22.5%, a difference of 0.81%), Central American Indian (22.5%, a difference of 0.95%), Menominee (23.0%, a difference of 1.1%), Paiute (22.4%, a difference of 1.3%), and Colville (23.0%, a difference of 1.5%).
| Demographics | Rating | Rank | Child Poverty Under the Age of 16 |
| Yakama | 0.0 /100 | #319 | Tragic 22.1% |
| Cajuns | 0.0 /100 | #320 | Tragic 22.1% |
| Kiowa | 0.0 /100 | #321 | Tragic 22.2% |
| Hondurans | 0.0 /100 | #322 | Tragic 22.2% |
| Paiute | 0.0 /100 | #323 | Tragic 22.4% |
| Central American Indians | 0.0 /100 | #324 | Tragic 22.5% |
| Immigrants | Congo | 0.0 /100 | #325 | Tragic 22.5% |
| Immigrants | Honduras | 0.0 /100 | #326 | Tragic 22.7% |
| Menominee | 0.0 /100 | #327 | Tragic 23.0% |
| Colville | 0.0 /100 | #328 | Tragic 23.0% |
| Dominicans | 0.0 /100 | #329 | Tragic 23.8% |
| Natives/Alaskans | 0.0 /100 | #330 | Tragic 23.8% |
| Apache | 0.0 /100 | #331 | Tragic 23.8% |
| Pueblo | 0.0 /100 | #332 | Tragic 23.9% |
| Immigrants | Dominican Republic | 0.0 /100 | #333 | Tragic 24.0% |
Demographics Similar to Immigrants from Latin America by Child Poverty Under the Age of 16
In terms of child poverty under the age of 16, the demographic groups most similar to Immigrants from Latin America are Chippewa (20.5%, a difference of 0.040%), Immigrants from Senegal (20.6%, a difference of 0.43%), Haitian (20.7%, a difference of 0.64%), Mexican (20.7%, a difference of 0.77%), and Yaqui (20.4%, a difference of 0.79%).
| Demographics | Rating | Rank | Child Poverty Under the Age of 16 |
| Immigrants | St. Vincent and the Grenadines | 0.0 /100 | #285 | Tragic 20.1% |
| Immigrants | West Indies | 0.0 /100 | #286 | Tragic 20.2% |
| Blackfeet | 0.0 /100 | #287 | Tragic 20.2% |
| Immigrants | Belize | 0.0 /100 | #288 | Tragic 20.3% |
| Senegalese | 0.0 /100 | #289 | Tragic 20.4% |
| Yaqui | 0.0 /100 | #290 | Tragic 20.4% |
| Chippewa | 0.0 /100 | #291 | Tragic 20.5% |
| Immigrants | Latin America | 0.0 /100 | #292 | Tragic 20.5% |
| Immigrants | Senegal | 0.0 /100 | #293 | Tragic 20.6% |
| Haitians | 0.0 /100 | #294 | Tragic 20.7% |
| Mexicans | 0.0 /100 | #295 | Tragic 20.7% |
| Immigrants | Caribbean | 0.0 /100 | #296 | Tragic 20.8% |
| Hispanics or Latinos | 0.0 /100 | #297 | Tragic 20.8% |
| Arapaho | 0.0 /100 | #298 | Tragic 20.8% |
| Immigrants | Haiti | 0.0 /100 | #299 | Tragic 20.9% |