Immigrants from Cabo Verde vs Immigrants from England Child Poverty Under the Age of 5
COMPARE
Immigrants from Cabo Verde
Immigrants from England
Child Poverty Under the Age of 5
Child Poverty Under the Age of 5 Comparison
Immigrants from Cabo Verde
Immigrants from England
19.5%
CHILD POVERTY UNDER THE AGE OF 5
0.6/ 100
METRIC RATING
237th/ 347
METRIC RANK
16.2%
CHILD POVERTY UNDER THE AGE OF 5
91.5/ 100
METRIC RATING
127th/ 347
METRIC RANK
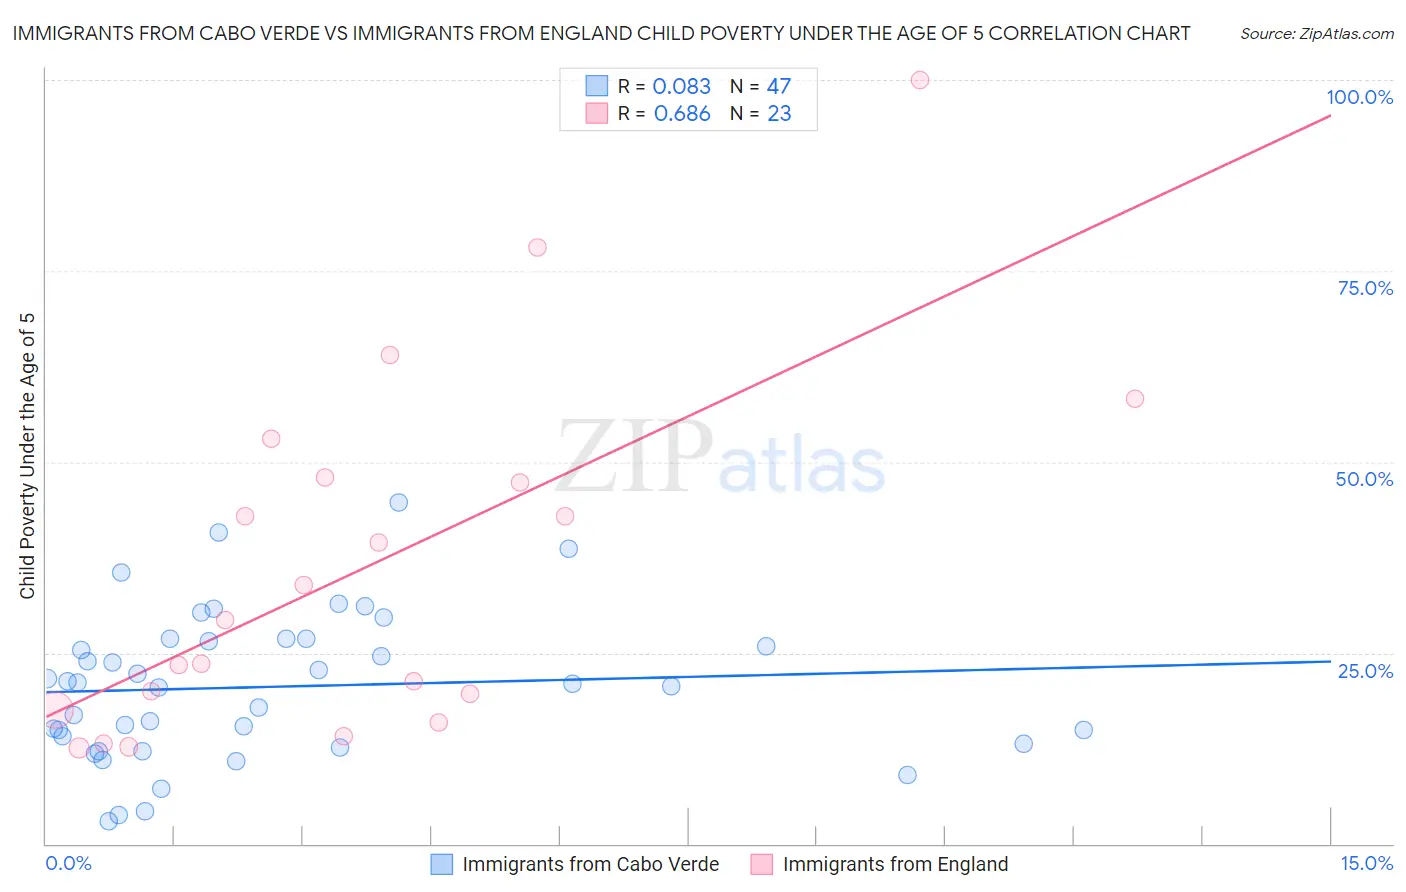
Immigrants from Cabo Verde vs Immigrants from England Child Poverty Under the Age of 5 Correlation Chart
The statistical analysis conducted on geographies consisting of 37,664,578 people shows a slight positive correlation between the proportion of Immigrants from Cabo Verde and poverty level among children under the age of 5 in the United States with a correlation coefficient (R) of 0.083 and weighted average of 19.5%. Similarly, the statistical analysis conducted on geographies consisting of 373,543,050 people shows a significant positive correlation between the proportion of Immigrants from England and poverty level among children under the age of 5 in the United States with a correlation coefficient (R) of 0.686 and weighted average of 16.2%, a difference of 20.6%.
Child Poverty Under the Age of 5 Correlation Summary
| Measurement | Immigrants from Cabo Verde | Immigrants from England |
| Minimum | 3.0% | 12.5% |
| Maximum | 44.7% | 100.0% |
| Range | 41.6% | 87.5% |
| Mean | 20.6% | 36.1% |
| Median | 21.0% | 29.3% |
| Interquartile 25% (IQ1) | 13.1% | 17.6% |
| Interquartile 75% (IQ3) | 26.8% | 48.0% |
| Interquartile Range (IQR) | 13.8% | 30.5% |
| Standard Deviation (Sample) | 9.6% | 23.1% |
| Standard Deviation (Population) | 9.5% | 22.6% |
Similar Demographics by Child Poverty Under the Age of 5
Demographics Similar to Immigrants from Cabo Verde by Child Poverty Under the Age of 5
In terms of child poverty under the age of 5, the demographic groups most similar to Immigrants from Cabo Verde are Salvadoran (19.5%, a difference of 0.010%), Vietnamese (19.5%, a difference of 0.040%), Immigrants from Ecuador (19.6%, a difference of 0.41%), Alaska Native (19.6%, a difference of 0.48%), and Immigrants from Trinidad and Tobago (19.4%, a difference of 0.55%).
| Demographics | Rating | Rank | Child Poverty Under the Age of 5 |
| Ecuadorians | 1.2 /100 | #230 | Tragic 19.2% |
| Bermudans | 1.2 /100 | #231 | Tragic 19.2% |
| Trinidadians and Tobagonians | 0.9 /100 | #232 | Tragic 19.3% |
| Sudanese | 0.9 /100 | #233 | Tragic 19.3% |
| Immigrants | Micronesia | 0.9 /100 | #234 | Tragic 19.4% |
| Immigrants | Laos | 0.8 /100 | #235 | Tragic 19.4% |
| Immigrants | Trinidad and Tobago | 0.8 /100 | #236 | Tragic 19.4% |
| Immigrants | Cabo Verde | 0.6 /100 | #237 | Tragic 19.5% |
| Salvadorans | 0.6 /100 | #238 | Tragic 19.5% |
| Vietnamese | 0.6 /100 | #239 | Tragic 19.5% |
| Immigrants | Ecuador | 0.5 /100 | #240 | Tragic 19.6% |
| Alaska Natives | 0.5 /100 | #241 | Tragic 19.6% |
| Immigrants | Guyana | 0.5 /100 | #242 | Tragic 19.6% |
| Osage | 0.5 /100 | #243 | Tragic 19.6% |
| Immigrants | Ghana | 0.5 /100 | #244 | Tragic 19.6% |
Demographics Similar to Immigrants from England by Child Poverty Under the Age of 5
In terms of child poverty under the age of 5, the demographic groups most similar to Immigrants from England are Immigrants from Albania (16.2%, a difference of 0.080%), Native Hawaiian (16.2%, a difference of 0.090%), Swiss (16.1%, a difference of 0.16%), Austrian (16.1%, a difference of 0.17%), and Immigrants from Southern Europe (16.1%, a difference of 0.19%).
| Demographics | Rating | Rank | Child Poverty Under the Age of 5 |
| Immigrants | Peru | 92.6 /100 | #120 | Exceptional 16.1% |
| Mongolians | 92.5 /100 | #121 | Exceptional 16.1% |
| Immigrants | Southern Europe | 92.0 /100 | #122 | Exceptional 16.1% |
| Austrians | 92.0 /100 | #123 | Exceptional 16.1% |
| Swiss | 92.0 /100 | #124 | Exceptional 16.1% |
| Native Hawaiians | 91.8 /100 | #125 | Exceptional 16.2% |
| Immigrants | Albania | 91.8 /100 | #126 | Exceptional 16.2% |
| Immigrants | England | 91.5 /100 | #127 | Exceptional 16.2% |
| South Africans | 90.1 /100 | #128 | Exceptional 16.2% |
| British | 89.4 /100 | #129 | Excellent 16.3% |
| Immigrants | Norway | 89.3 /100 | #130 | Excellent 16.3% |
| Finns | 88.3 /100 | #131 | Excellent 16.3% |
| Serbians | 88.2 /100 | #132 | Excellent 16.3% |
| Icelanders | 87.9 /100 | #133 | Excellent 16.3% |
| Immigrants | North Macedonia | 87.8 /100 | #134 | Excellent 16.4% |