Immigrants from Nicaragua vs Somali Child Poverty Under the Age of 16
COMPARE
Immigrants from Nicaragua
Somali
Child Poverty Under the Age of 16
Child Poverty Under the Age of 16 Comparison
Immigrants from Nicaragua
Somalis
18.8%
CHILD POVERTY UNDER THE AGE OF 16
0.4/ 100
METRIC RATING
246th/ 347
METRIC RANK
21.0%
CHILD POVERTY UNDER THE AGE OF 16
0.0/ 100
METRIC RATING
304th/ 347
METRIC RANK
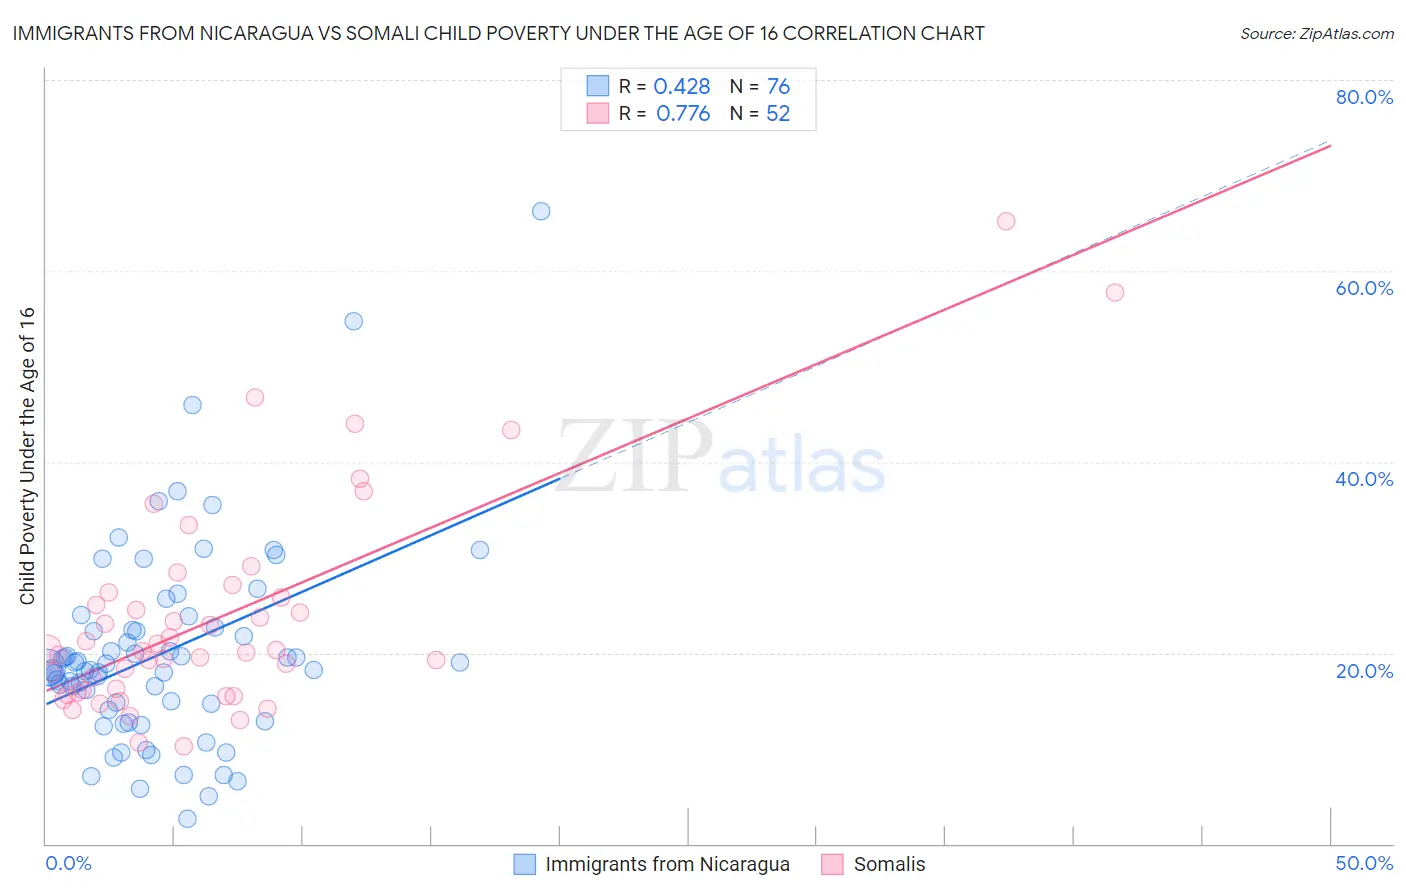
Immigrants from Nicaragua vs Somali Child Poverty Under the Age of 16 Correlation Chart
The statistical analysis conducted on geographies consisting of 235,832,733 people shows a moderate positive correlation between the proportion of Immigrants from Nicaragua and poverty level among children under the age of 16 in the United States with a correlation coefficient (R) of 0.428 and weighted average of 18.8%. Similarly, the statistical analysis conducted on geographies consisting of 99,170,340 people shows a strong positive correlation between the proportion of Somalis and poverty level among children under the age of 16 in the United States with a correlation coefficient (R) of 0.776 and weighted average of 21.0%, a difference of 11.7%.
Child Poverty Under the Age of 16 Correlation Summary
| Measurement | Immigrants from Nicaragua | Somali |
| Minimum | 2.6% | 10.2% |
| Maximum | 66.2% | 65.2% |
| Range | 63.6% | 55.1% |
| Mean | 20.0% | 23.7% |
| Median | 18.3% | 20.2% |
| Interquartile 25% (IQ1) | 14.3% | 16.0% |
| Interquartile 75% (IQ3) | 22.5% | 26.1% |
| Interquartile Range (IQR) | 8.1% | 10.1% |
| Standard Deviation (Sample) | 10.5% | 11.3% |
| Standard Deviation (Population) | 10.5% | 11.2% |
Similar Demographics by Child Poverty Under the Age of 16
Demographics Similar to Immigrants from Nicaragua by Child Poverty Under the Age of 16
In terms of child poverty under the age of 16, the demographic groups most similar to Immigrants from Nicaragua are Shoshone (18.8%, a difference of 0.030%), French American Indian (18.9%, a difference of 0.24%), Ecuadorian (19.0%, a difference of 0.67%), Cape Verdean (18.7%, a difference of 0.68%), and Immigrants from Cuba (18.7%, a difference of 0.75%).
| Demographics | Rating | Rank | Child Poverty Under the Age of 16 |
| Immigrants | Sudan | 0.8 /100 | #239 | Tragic 18.5% |
| Ghanaians | 0.8 /100 | #240 | Tragic 18.6% |
| Alsatians | 0.7 /100 | #241 | Tragic 18.6% |
| Immigrants | Laos | 0.6 /100 | #242 | Tragic 18.7% |
| Immigrants | Cuba | 0.6 /100 | #243 | Tragic 18.7% |
| Cape Verdeans | 0.6 /100 | #244 | Tragic 18.7% |
| Shoshone | 0.5 /100 | #245 | Tragic 18.8% |
| Immigrants | Nicaragua | 0.4 /100 | #246 | Tragic 18.8% |
| French American Indians | 0.4 /100 | #247 | Tragic 18.9% |
| Ecuadorians | 0.3 /100 | #248 | Tragic 19.0% |
| Potawatomi | 0.3 /100 | #249 | Tragic 19.0% |
| Immigrants | Middle Africa | 0.3 /100 | #250 | Tragic 19.0% |
| Immigrants | Ghana | 0.3 /100 | #251 | Tragic 19.1% |
| Immigrants | Trinidad and Tobago | 0.3 /100 | #252 | Tragic 19.1% |
| Salvadorans | 0.3 /100 | #253 | Tragic 19.1% |
Demographics Similar to Somalis by Child Poverty Under the Age of 16
In terms of child poverty under the age of 16, the demographic groups most similar to Somalis are Choctaw (21.0%, a difference of 0.050%), Immigrants from Bahamas (21.0%, a difference of 0.090%), Immigrants from Grenada (21.0%, a difference of 0.33%), Indonesian (21.0%, a difference of 0.37%), and Seminole (21.1%, a difference of 0.47%).
| Demographics | Rating | Rank | Child Poverty Under the Age of 16 |
| Hispanics or Latinos | 0.0 /100 | #297 | Tragic 20.8% |
| Arapaho | 0.0 /100 | #298 | Tragic 20.8% |
| Immigrants | Haiti | 0.0 /100 | #299 | Tragic 20.9% |
| Indonesians | 0.0 /100 | #300 | Tragic 21.0% |
| Immigrants | Grenada | 0.0 /100 | #301 | Tragic 21.0% |
| Immigrants | Bahamas | 0.0 /100 | #302 | Tragic 21.0% |
| Choctaw | 0.0 /100 | #303 | Tragic 21.0% |
| Somalis | 0.0 /100 | #304 | Tragic 21.0% |
| Seminole | 0.0 /100 | #305 | Tragic 21.1% |
| Guatemalans | 0.0 /100 | #306 | Tragic 21.2% |
| Immigrants | Central America | 0.0 /100 | #307 | Tragic 21.3% |
| British West Indians | 0.0 /100 | #308 | Tragic 21.3% |
| Immigrants | Mexico | 0.0 /100 | #309 | Tragic 21.5% |
| Bahamians | 0.0 /100 | #310 | Tragic 21.5% |
| Dutch West Indians | 0.0 /100 | #311 | Tragic 21.5% |