Immigrants from Nicaragua vs Immigrants from Zaire Female Poverty Among 25-34 Year Olds
COMPARE
Immigrants from Nicaragua
Immigrants from Zaire
Female Poverty Among 25-34 Year Olds
Female Poverty Among 25-34 Year Olds Comparison
Immigrants from Nicaragua
Immigrants from Zaire
14.8%
FEMALE POVERTY AMONG 25-34 YEAR OLDS
1.1/ 100
METRIC RATING
243rd/ 347
METRIC RANK
15.8%
FEMALE POVERTY AMONG 25-34 YEAR OLDS
0.0/ 100
METRIC RATING
276th/ 347
METRIC RANK
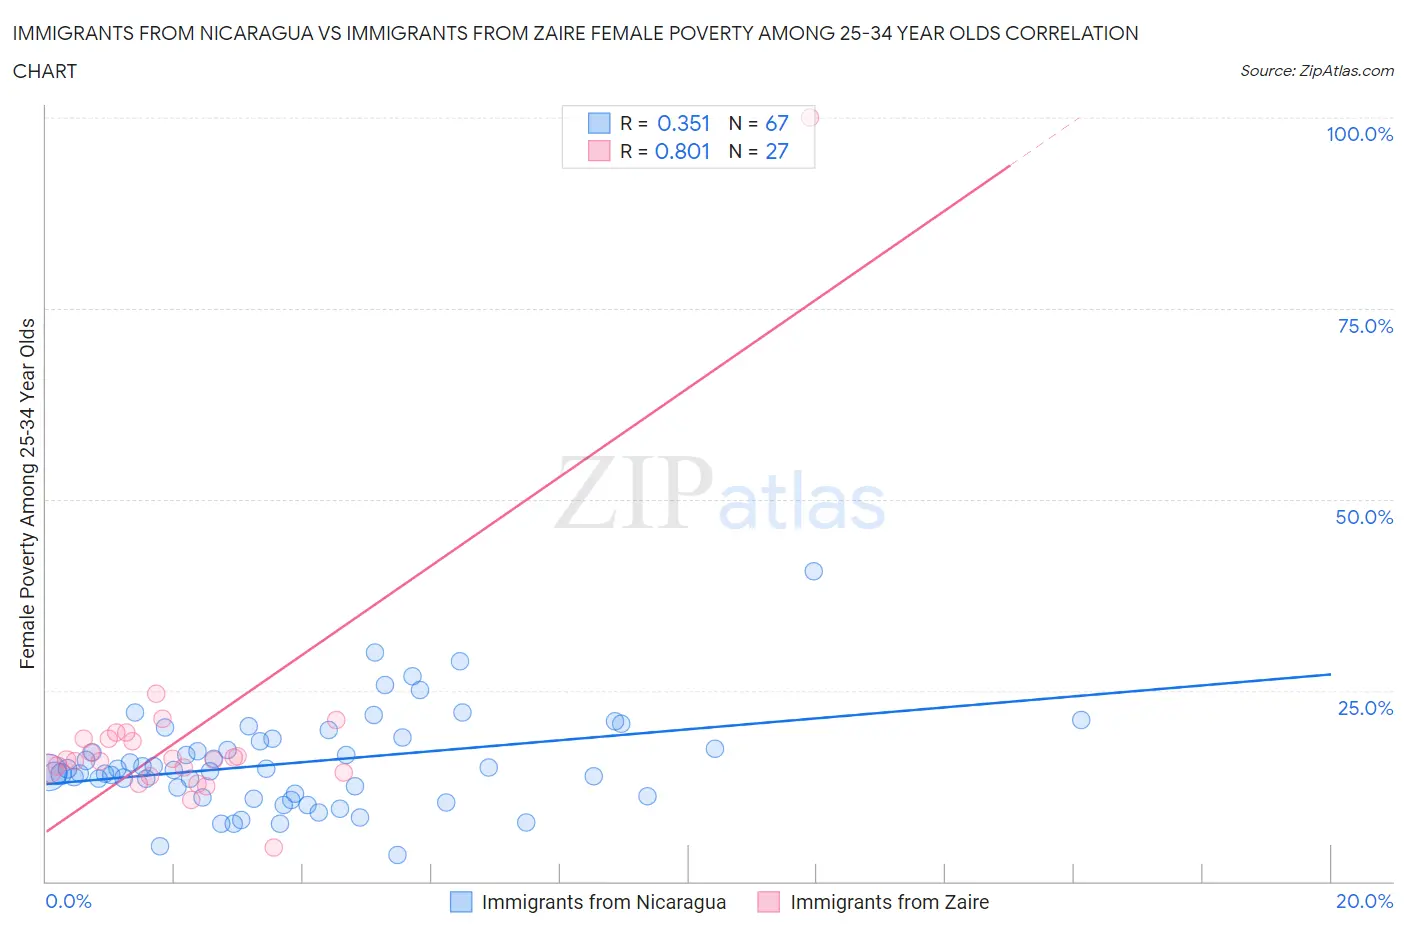
Immigrants from Nicaragua vs Immigrants from Zaire Female Poverty Among 25-34 Year Olds Correlation Chart
The statistical analysis conducted on geographies consisting of 235,106,985 people shows a mild positive correlation between the proportion of Immigrants from Nicaragua and poverty level among females between the ages 25 and 34 in the United States with a correlation coefficient (R) of 0.351 and weighted average of 14.8%. Similarly, the statistical analysis conducted on geographies consisting of 106,944,987 people shows a very strong positive correlation between the proportion of Immigrants from Zaire and poverty level among females between the ages 25 and 34 in the United States with a correlation coefficient (R) of 0.801 and weighted average of 15.8%, a difference of 7.1%.
Female Poverty Among 25-34 Year Olds Correlation Summary
| Measurement | Immigrants from Nicaragua | Immigrants from Zaire |
| Minimum | 3.4% | 4.4% |
| Maximum | 40.6% | 100.0% |
| Range | 37.2% | 95.6% |
| Mean | 15.5% | 19.1% |
| Median | 14.5% | 15.9% |
| Interquartile 25% (IQ1) | 11.1% | 14.3% |
| Interquartile 75% (IQ3) | 18.6% | 18.6% |
| Interquartile Range (IQR) | 7.5% | 4.3% |
| Standard Deviation (Sample) | 6.3% | 16.6% |
| Standard Deviation (Population) | 6.2% | 16.3% |
Similar Demographics by Female Poverty Among 25-34 Year Olds
Demographics Similar to Immigrants from Nicaragua by Female Poverty Among 25-34 Year Olds
In terms of female poverty among 25-34 year olds, the demographic groups most similar to Immigrants from Nicaragua are Immigrants from Bangladesh (14.8%, a difference of 0.010%), Scotch-Irish (14.8%, a difference of 0.040%), Barbadian (14.8%, a difference of 0.040%), Immigrants from Middle Africa (14.8%, a difference of 0.19%), and Jamaican (14.8%, a difference of 0.22%).
| Demographics | Rating | Rank | Female Poverty Among 25-34 Year Olds |
| Salvadorans | 1.4 /100 | #236 | Tragic 14.7% |
| Immigrants | Ghana | 1.4 /100 | #237 | Tragic 14.7% |
| Alsatians | 1.4 /100 | #238 | Tragic 14.7% |
| Malaysians | 1.4 /100 | #239 | Tragic 14.7% |
| Immigrants | Grenada | 1.3 /100 | #240 | Tragic 14.7% |
| Scotch-Irish | 1.2 /100 | #241 | Tragic 14.8% |
| Barbadians | 1.2 /100 | #242 | Tragic 14.8% |
| Immigrants | Nicaragua | 1.1 /100 | #243 | Tragic 14.8% |
| Immigrants | Bangladesh | 1.1 /100 | #244 | Tragic 14.8% |
| Immigrants | Middle Africa | 1.0 /100 | #245 | Tragic 14.8% |
| Jamaicans | 1.0 /100 | #246 | Tragic 14.8% |
| German Russians | 0.8 /100 | #247 | Tragic 14.9% |
| Immigrants | Western Africa | 0.8 /100 | #248 | Tragic 14.9% |
| Immigrants | Haiti | 0.5 /100 | #249 | Tragic 15.0% |
| Immigrants | El Salvador | 0.5 /100 | #250 | Tragic 15.0% |
Demographics Similar to Immigrants from Zaire by Female Poverty Among 25-34 Year Olds
In terms of female poverty among 25-34 year olds, the demographic groups most similar to Immigrants from Zaire are Immigrants from Micronesia (15.8%, a difference of 0.010%), French American Indian (15.9%, a difference of 0.30%), Fijian (15.9%, a difference of 0.30%), Immigrants from the Azores (15.8%, a difference of 0.42%), and Bangladeshi (15.9%, a difference of 0.46%).
| Demographics | Rating | Rank | Female Poverty Among 25-34 Year Olds |
| Sub-Saharan Africans | 0.1 /100 | #269 | Tragic 15.6% |
| British West Indians | 0.1 /100 | #270 | Tragic 15.6% |
| Cree | 0.1 /100 | #271 | Tragic 15.6% |
| Senegalese | 0.1 /100 | #272 | Tragic 15.6% |
| Immigrants | Nonimmigrants | 0.1 /100 | #273 | Tragic 15.6% |
| Immigrants | Caribbean | 0.0 /100 | #274 | Tragic 15.7% |
| Immigrants | Azores | 0.0 /100 | #275 | Tragic 15.8% |
| Immigrants | Zaire | 0.0 /100 | #276 | Tragic 15.8% |
| Immigrants | Micronesia | 0.0 /100 | #277 | Tragic 15.8% |
| French American Indians | 0.0 /100 | #278 | Tragic 15.9% |
| Fijians | 0.0 /100 | #279 | Tragic 15.9% |
| Bangladeshis | 0.0 /100 | #280 | Tragic 15.9% |
| Immigrants | Latin America | 0.0 /100 | #281 | Tragic 16.0% |
| Aleuts | 0.0 /100 | #282 | Tragic 16.1% |
| Bahamians | 0.0 /100 | #283 | Tragic 16.1% |