Immigrants from Guatemala vs Immigrants from Zaire Female Poverty Among 25-34 Year Olds
COMPARE
Immigrants from Guatemala
Immigrants from Zaire
Female Poverty Among 25-34 Year Olds
Female Poverty Among 25-34 Year Olds Comparison
Immigrants from Guatemala
Immigrants from Zaire
16.6%
FEMALE POVERTY AMONG 25-34 YEAR OLDS
0.0/ 100
METRIC RATING
297th/ 347
METRIC RANK
15.8%
FEMALE POVERTY AMONG 25-34 YEAR OLDS
0.0/ 100
METRIC RATING
276th/ 347
METRIC RANK
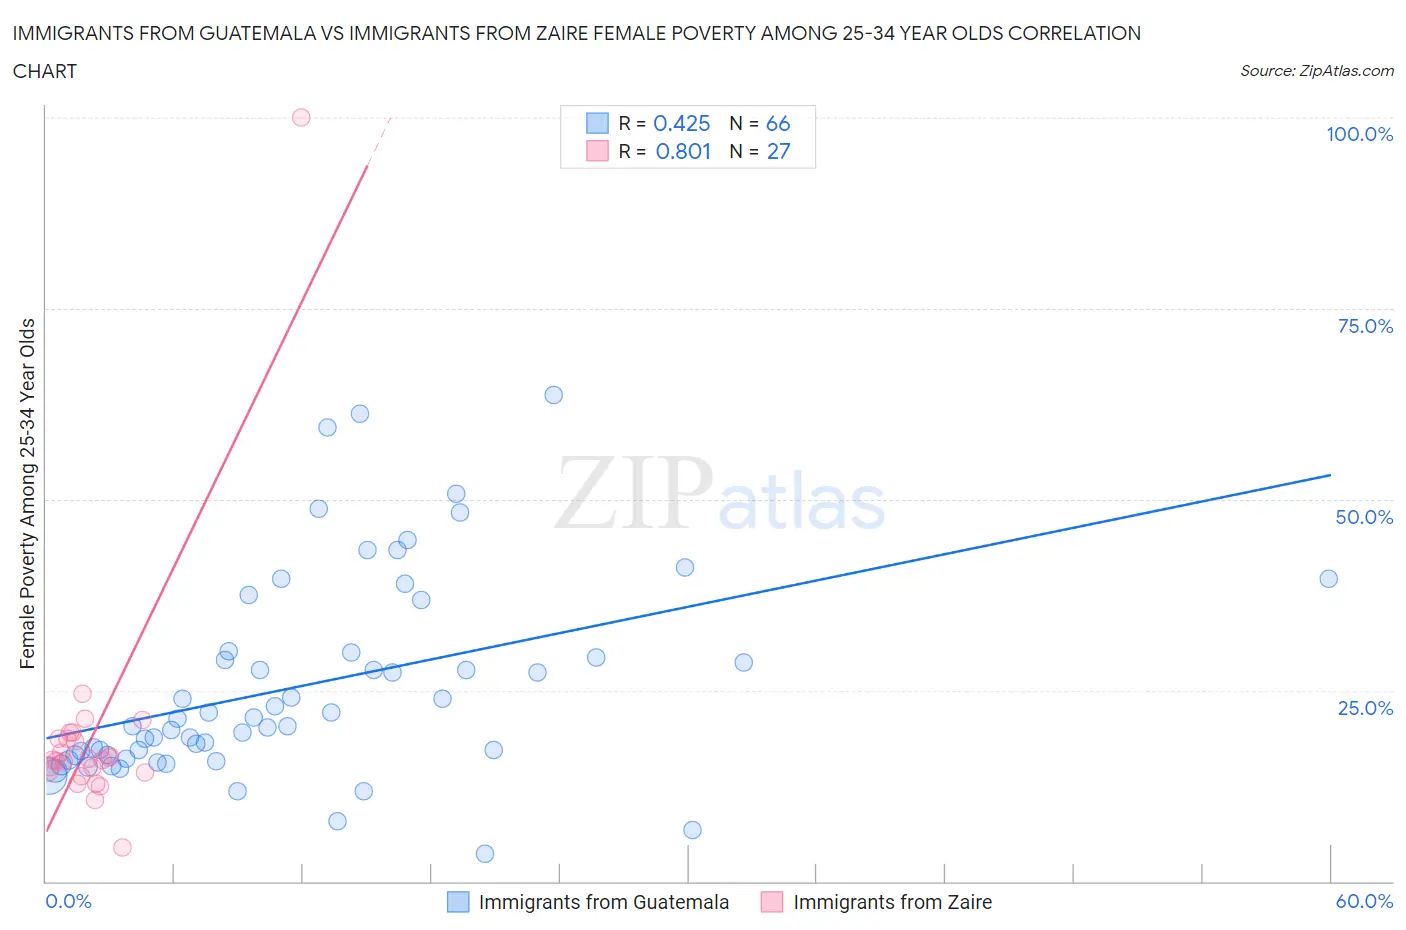
Immigrants from Guatemala vs Immigrants from Zaire Female Poverty Among 25-34 Year Olds Correlation Chart
The statistical analysis conducted on geographies consisting of 373,350,346 people shows a moderate positive correlation between the proportion of Immigrants from Guatemala and poverty level among females between the ages 25 and 34 in the United States with a correlation coefficient (R) of 0.425 and weighted average of 16.6%. Similarly, the statistical analysis conducted on geographies consisting of 106,944,987 people shows a very strong positive correlation between the proportion of Immigrants from Zaire and poverty level among females between the ages 25 and 34 in the United States with a correlation coefficient (R) of 0.801 and weighted average of 15.8%, a difference of 5.0%.
Female Poverty Among 25-34 Year Olds Correlation Summary
| Measurement | Immigrants from Guatemala | Immigrants from Zaire |
| Minimum | 3.7% | 4.4% |
| Maximum | 63.6% | 100.0% |
| Range | 60.0% | 95.6% |
| Mean | 25.5% | 19.1% |
| Median | 20.8% | 15.9% |
| Interquartile 25% (IQ1) | 16.5% | 14.3% |
| Interquartile 75% (IQ3) | 30.0% | 18.6% |
| Interquartile Range (IQR) | 13.5% | 4.3% |
| Standard Deviation (Sample) | 13.3% | 16.6% |
| Standard Deviation (Population) | 13.2% | 16.3% |
Similar Demographics by Female Poverty Among 25-34 Year Olds
Demographics Similar to Immigrants from Guatemala by Female Poverty Among 25-34 Year Olds
In terms of female poverty among 25-34 year olds, the demographic groups most similar to Immigrants from Guatemala are Hispanic or Latino (16.6%, a difference of 0.060%), Mexican (16.6%, a difference of 0.26%), Immigrants from Central America (16.6%, a difference of 0.33%), Blackfeet (16.7%, a difference of 0.51%), and Spanish American (16.7%, a difference of 0.55%).
| Demographics | Rating | Rank | Female Poverty Among 25-34 Year Olds |
| Indonesians | 0.0 /100 | #290 | Tragic 16.4% |
| Comanche | 0.0 /100 | #291 | Tragic 16.5% |
| Immigrants | Dominica | 0.0 /100 | #292 | Tragic 16.5% |
| Potawatomi | 0.0 /100 | #293 | Tragic 16.5% |
| Immigrants | Central America | 0.0 /100 | #294 | Tragic 16.6% |
| Mexicans | 0.0 /100 | #295 | Tragic 16.6% |
| Hispanics or Latinos | 0.0 /100 | #296 | Tragic 16.6% |
| Immigrants | Guatemala | 0.0 /100 | #297 | Tragic 16.6% |
| Blackfeet | 0.0 /100 | #298 | Tragic 16.7% |
| Spanish Americans | 0.0 /100 | #299 | Tragic 16.7% |
| U.S. Virgin Islanders | 0.0 /100 | #300 | Tragic 16.7% |
| Immigrants | Congo | 0.0 /100 | #301 | Tragic 16.7% |
| Alaska Natives | 0.0 /100 | #302 | Tragic 16.8% |
| Immigrants | Mexico | 0.0 /100 | #303 | Tragic 16.8% |
| Hondurans | 0.0 /100 | #304 | Tragic 16.9% |
Demographics Similar to Immigrants from Zaire by Female Poverty Among 25-34 Year Olds
In terms of female poverty among 25-34 year olds, the demographic groups most similar to Immigrants from Zaire are Immigrants from Micronesia (15.8%, a difference of 0.010%), French American Indian (15.9%, a difference of 0.30%), Fijian (15.9%, a difference of 0.30%), Immigrants from the Azores (15.8%, a difference of 0.42%), and Bangladeshi (15.9%, a difference of 0.46%).
| Demographics | Rating | Rank | Female Poverty Among 25-34 Year Olds |
| Sub-Saharan Africans | 0.1 /100 | #269 | Tragic 15.6% |
| British West Indians | 0.1 /100 | #270 | Tragic 15.6% |
| Cree | 0.1 /100 | #271 | Tragic 15.6% |
| Senegalese | 0.1 /100 | #272 | Tragic 15.6% |
| Immigrants | Nonimmigrants | 0.1 /100 | #273 | Tragic 15.6% |
| Immigrants | Caribbean | 0.0 /100 | #274 | Tragic 15.7% |
| Immigrants | Azores | 0.0 /100 | #275 | Tragic 15.8% |
| Immigrants | Zaire | 0.0 /100 | #276 | Tragic 15.8% |
| Immigrants | Micronesia | 0.0 /100 | #277 | Tragic 15.8% |
| French American Indians | 0.0 /100 | #278 | Tragic 15.9% |
| Fijians | 0.0 /100 | #279 | Tragic 15.9% |
| Bangladeshis | 0.0 /100 | #280 | Tragic 15.9% |
| Immigrants | Latin America | 0.0 /100 | #281 | Tragic 16.0% |
| Aleuts | 0.0 /100 | #282 | Tragic 16.1% |
| Bahamians | 0.0 /100 | #283 | Tragic 16.1% |