Immigrants from Nicaragua vs Basque Female Poverty Among 25-34 Year Olds
COMPARE
Immigrants from Nicaragua
Basque
Female Poverty Among 25-34 Year Olds
Female Poverty Among 25-34 Year Olds Comparison
Immigrants from Nicaragua
Basques
14.8%
FEMALE POVERTY AMONG 25-34 YEAR OLDS
1.1/ 100
METRIC RATING
243rd/ 347
METRIC RANK
13.4%
FEMALE POVERTY AMONG 25-34 YEAR OLDS
59.3/ 100
METRIC RATING
165th/ 347
METRIC RANK
Immigrants from Nicaragua vs Basque Female Poverty Among 25-34 Year Olds Correlation Chart
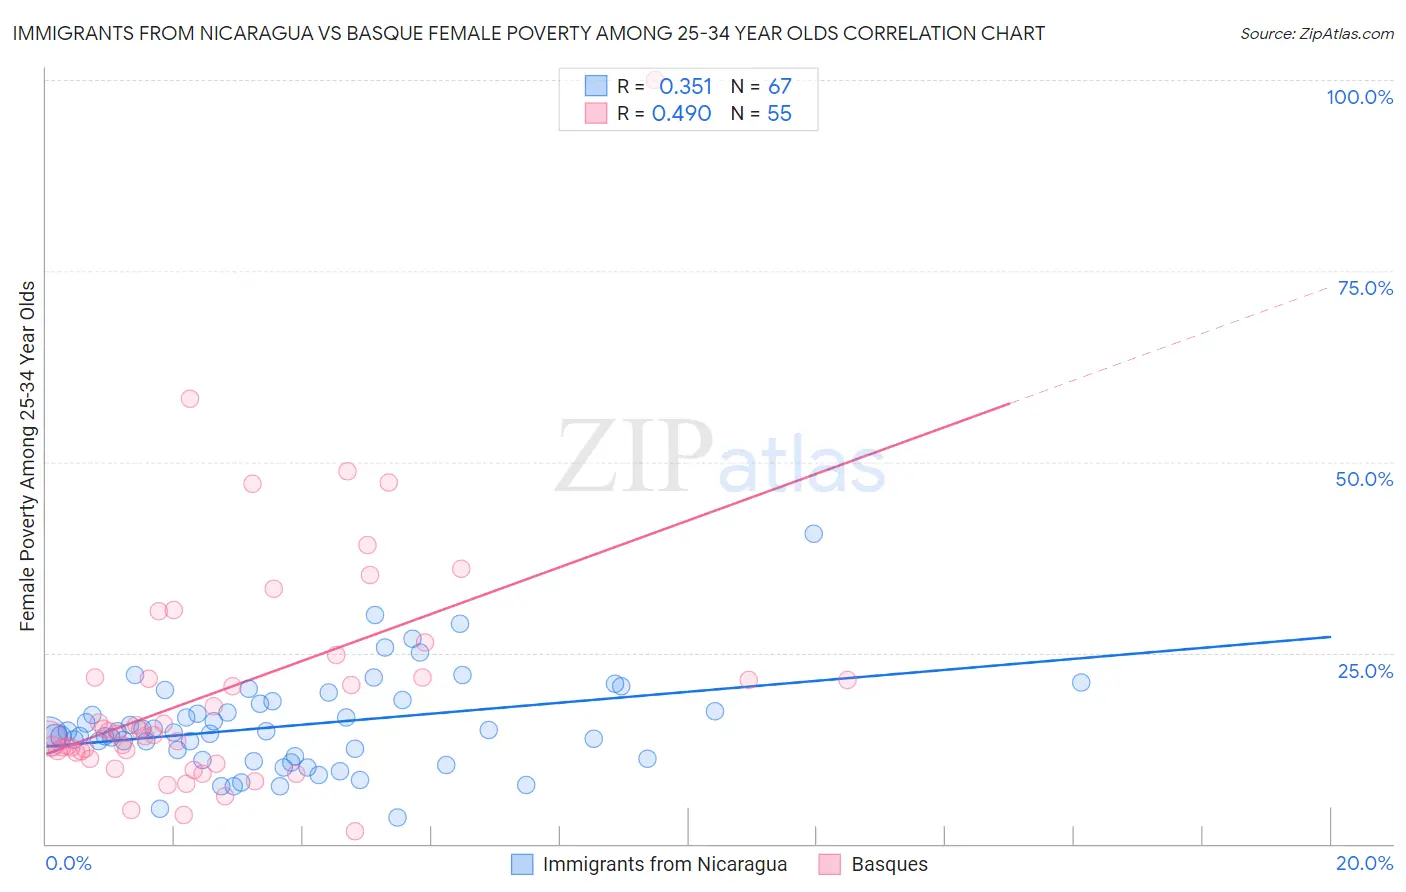
The statistical analysis conducted on geographies consisting of 235,106,985 people shows a mild positive correlation between the proportion of Immigrants from Nicaragua and poverty level among females between the ages 25 and 34 in the United States with a correlation coefficient (R) of 0.351 and weighted average of 14.8%. Similarly, the statistical analysis conducted on geographies consisting of 164,712,291 people shows a moderate positive correlation between the proportion of Basques and poverty level among females between the ages 25 and 34 in the United States with a correlation coefficient (R) of 0.490 and weighted average of 13.4%, a difference of 10.2%.
Female Poverty Among 25-34 Year Olds Correlation Summary
| Measurement | Immigrants from Nicaragua | Basque |
| Minimum | 3.4% | 1.7% |
| Maximum | 40.6% | 100.0% |
| Range | 37.2% | 98.3% |
| Mean | 15.5% | 20.2% |
| Median | 14.5% | 14.4% |
| Interquartile 25% (IQ1) | 11.1% | 12.0% |
| Interquartile 75% (IQ3) | 18.6% | 21.7% |
| Interquartile Range (IQR) | 7.5% | 9.8% |
| Standard Deviation (Sample) | 6.3% | 16.4% |
| Standard Deviation (Population) | 6.2% | 16.2% |
Similar Demographics by Female Poverty Among 25-34 Year Olds
Demographics Similar to Immigrants from Nicaragua by Female Poverty Among 25-34 Year Olds
In terms of female poverty among 25-34 year olds, the demographic groups most similar to Immigrants from Nicaragua are Immigrants from Bangladesh (14.8%, a difference of 0.010%), Scotch-Irish (14.8%, a difference of 0.040%), Barbadian (14.8%, a difference of 0.040%), Immigrants from Middle Africa (14.8%, a difference of 0.19%), and Jamaican (14.8%, a difference of 0.22%).
| Demographics | Rating | Rank | Female Poverty Among 25-34 Year Olds |
| Salvadorans | 1.4 /100 | #236 | Tragic 14.7% |
| Immigrants | Ghana | 1.4 /100 | #237 | Tragic 14.7% |
| Alsatians | 1.4 /100 | #238 | Tragic 14.7% |
| Malaysians | 1.4 /100 | #239 | Tragic 14.7% |
| Immigrants | Grenada | 1.3 /100 | #240 | Tragic 14.7% |
| Scotch-Irish | 1.2 /100 | #241 | Tragic 14.8% |
| Barbadians | 1.2 /100 | #242 | Tragic 14.8% |
| Immigrants | Nicaragua | 1.1 /100 | #243 | Tragic 14.8% |
| Immigrants | Bangladesh | 1.1 /100 | #244 | Tragic 14.8% |
| Immigrants | Middle Africa | 1.0 /100 | #245 | Tragic 14.8% |
| Jamaicans | 1.0 /100 | #246 | Tragic 14.8% |
| German Russians | 0.8 /100 | #247 | Tragic 14.9% |
| Immigrants | Western Africa | 0.8 /100 | #248 | Tragic 14.9% |
| Immigrants | Haiti | 0.5 /100 | #249 | Tragic 15.0% |
| Immigrants | El Salvador | 0.5 /100 | #250 | Tragic 15.0% |
Demographics Similar to Basques by Female Poverty Among 25-34 Year Olds
In terms of female poverty among 25-34 year olds, the demographic groups most similar to Basques are Belgian (13.4%, a difference of 0.030%), Immigrants from Bosnia and Herzegovina (13.4%, a difference of 0.060%), Immigrants from Afghanistan (13.4%, a difference of 0.14%), Swiss (13.4%, a difference of 0.21%), and Samoan (13.5%, a difference of 0.21%).
| Demographics | Rating | Rank | Female Poverty Among 25-34 Year Olds |
| Immigrants | Colombia | 69.2 /100 | #158 | Good 13.3% |
| Uruguayans | 66.9 /100 | #159 | Good 13.3% |
| Immigrants | South America | 66.3 /100 | #160 | Good 13.3% |
| Icelanders | 65.7 /100 | #161 | Good 13.3% |
| Ugandans | 64.1 /100 | #162 | Good 13.4% |
| British | 63.5 /100 | #163 | Good 13.4% |
| Swiss | 61.7 /100 | #164 | Good 13.4% |
| Basques | 59.3 /100 | #165 | Average 13.4% |
| Belgians | 58.9 /100 | #166 | Average 13.4% |
| Immigrants | Bosnia and Herzegovina | 58.6 /100 | #167 | Average 13.4% |
| Immigrants | Afghanistan | 57.7 /100 | #168 | Average 13.4% |
| Samoans | 56.8 /100 | #169 | Average 13.5% |
| Immigrants | Uganda | 53.0 /100 | #170 | Average 13.5% |
| South American Indians | 51.9 /100 | #171 | Average 13.5% |
| Immigrants | Costa Rica | 51.9 /100 | #172 | Average 13.5% |