Immigrants from Nicaragua vs Mexican Female Poverty Among 18-24 Year Olds
COMPARE
Immigrants from Nicaragua
Mexican
Female Poverty Among 18-24 Year Olds
Female Poverty Among 18-24 Year Olds Comparison
Immigrants from Nicaragua
Mexicans
17.9%
FEMALE POVERTY AMONG 18-24 YEAR OLDS
100.0/ 100
METRIC RATING
34th/ 347
METRIC RANK
20.5%
FEMALE POVERTY AMONG 18-24 YEAR OLDS
18.3/ 100
METRIC RATING
201st/ 347
METRIC RANK
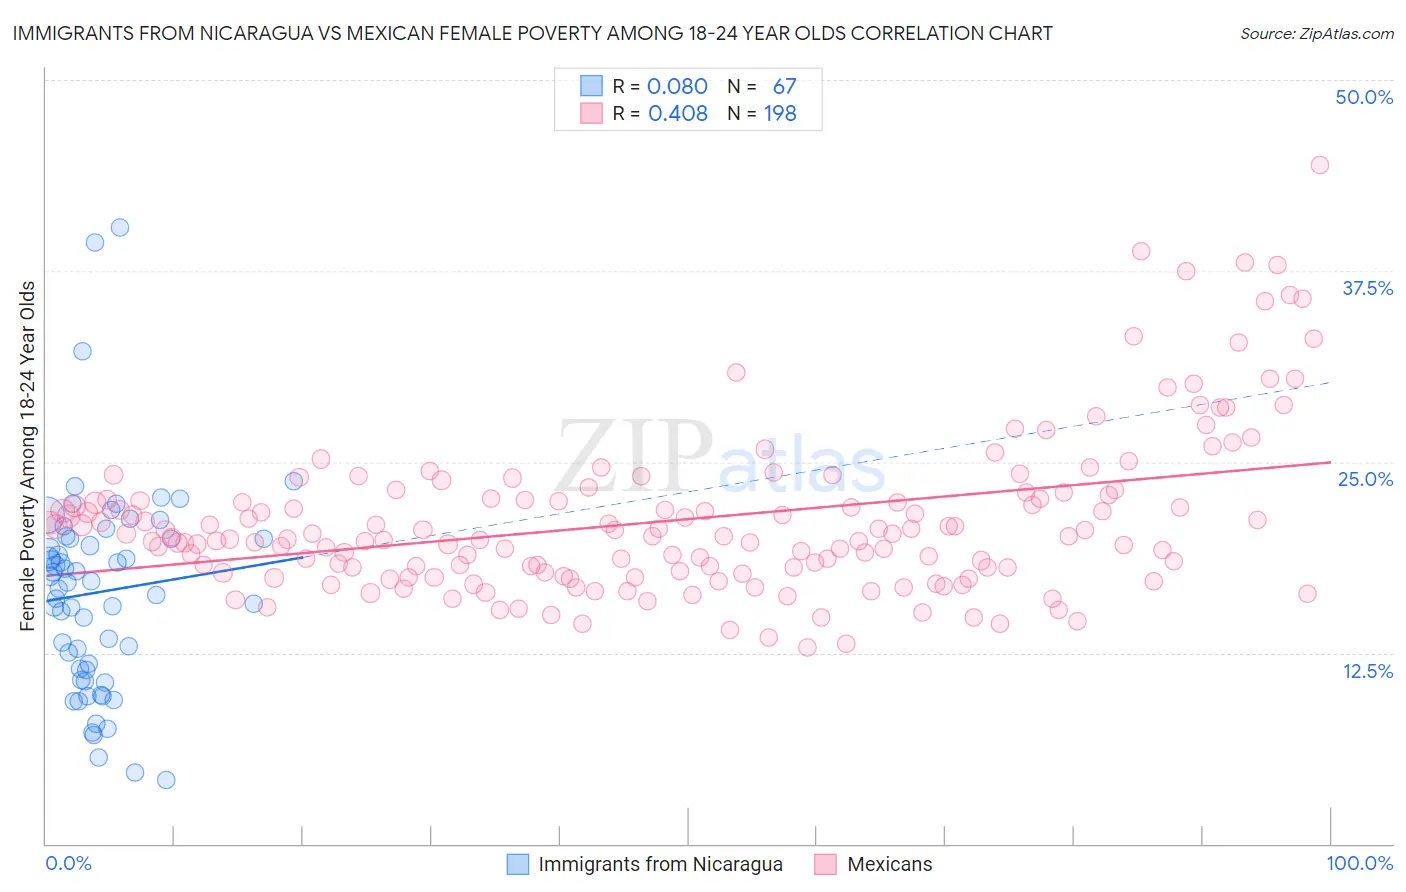
Immigrants from Nicaragua vs Mexican Female Poverty Among 18-24 Year Olds Correlation Chart
The statistical analysis conducted on geographies consisting of 234,065,649 people shows a slight positive correlation between the proportion of Immigrants from Nicaragua and poverty level among females between the ages 18 and 24 in the United States with a correlation coefficient (R) of 0.080 and weighted average of 17.9%. Similarly, the statistical analysis conducted on geographies consisting of 535,224,564 people shows a moderate positive correlation between the proportion of Mexicans and poverty level among females between the ages 18 and 24 in the United States with a correlation coefficient (R) of 0.408 and weighted average of 20.5%, a difference of 14.4%.
Female Poverty Among 18-24 Year Olds Correlation Summary
| Measurement | Immigrants from Nicaragua | Mexican |
| Minimum | 4.2% | 12.9% |
| Maximum | 40.3% | 44.4% |
| Range | 36.1% | 31.6% |
| Mean | 16.5% | 21.2% |
| Median | 17.1% | 20.1% |
| Interquartile 25% (IQ1) | 11.4% | 17.8% |
| Interquartile 75% (IQ3) | 20.0% | 22.6% |
| Interquartile Range (IQR) | 8.6% | 4.7% |
| Standard Deviation (Sample) | 6.9% | 5.2% |
| Standard Deviation (Population) | 6.8% | 5.2% |
Similar Demographics by Female Poverty Among 18-24 Year Olds
Demographics Similar to Immigrants from Nicaragua by Female Poverty Among 18-24 Year Olds
In terms of female poverty among 18-24 year olds, the demographic groups most similar to Immigrants from Nicaragua are Immigrants from Greece (17.9%, a difference of 0.040%), Immigrants from South America (17.9%, a difference of 0.090%), Native Hawaiian (17.9%, a difference of 0.12%), Immigrants from Moldova (17.9%, a difference of 0.14%), and Immigrants from Croatia (17.9%, a difference of 0.14%).
| Demographics | Rating | Rank | Female Poverty Among 18-24 Year Olds |
| Colombians | 100.0 /100 | #27 | Exceptional 17.7% |
| Venezuelans | 100.0 /100 | #28 | Exceptional 17.7% |
| Portuguese | 100.0 /100 | #29 | Exceptional 17.8% |
| Immigrants | South Eastern Asia | 100.0 /100 | #30 | Exceptional 17.8% |
| Immigrants | Vietnam | 100.0 /100 | #31 | Exceptional 17.8% |
| Immigrants | Moldova | 100.0 /100 | #32 | Exceptional 17.9% |
| Native Hawaiians | 100.0 /100 | #33 | Exceptional 17.9% |
| Immigrants | Nicaragua | 100.0 /100 | #34 | Exceptional 17.9% |
| Immigrants | Greece | 100.0 /100 | #35 | Exceptional 17.9% |
| Immigrants | South America | 100.0 /100 | #36 | Exceptional 17.9% |
| Immigrants | Croatia | 100.0 /100 | #37 | Exceptional 17.9% |
| South Americans | 100.0 /100 | #38 | Exceptional 18.0% |
| Puget Sound Salish | 100.0 /100 | #39 | Exceptional 18.0% |
| Immigrants | Romania | 100.0 /100 | #40 | Exceptional 18.0% |
| Immigrants | Argentina | 100.0 /100 | #41 | Exceptional 18.0% |
Demographics Similar to Mexicans by Female Poverty Among 18-24 Year Olds
In terms of female poverty among 18-24 year olds, the demographic groups most similar to Mexicans are Immigrants from Turkey (20.5%, a difference of 0.050%), Immigrants from Malaysia (20.5%, a difference of 0.090%), Immigrants from Netherlands (20.5%, a difference of 0.11%), European (20.4%, a difference of 0.13%), and English (20.5%, a difference of 0.13%).
| Demographics | Rating | Rank | Female Poverty Among 18-24 Year Olds |
| Mexican American Indians | 23.2 /100 | #194 | Fair 20.4% |
| Immigrants | Latvia | 23.0 /100 | #195 | Fair 20.4% |
| Czechs | 22.3 /100 | #196 | Fair 20.4% |
| Zimbabweans | 21.0 /100 | #197 | Fair 20.4% |
| Immigrants | Spain | 20.7 /100 | #198 | Fair 20.4% |
| Germans | 20.6 /100 | #199 | Fair 20.4% |
| Europeans | 19.9 /100 | #200 | Poor 20.4% |
| Mexicans | 18.3 /100 | #201 | Poor 20.5% |
| Immigrants | Turkey | 17.7 /100 | #202 | Poor 20.5% |
| Immigrants | Malaysia | 17.2 /100 | #203 | Poor 20.5% |
| Immigrants | Netherlands | 17.0 /100 | #204 | Poor 20.5% |
| English | 16.7 /100 | #205 | Poor 20.5% |
| Hispanics or Latinos | 16.6 /100 | #206 | Poor 20.5% |
| Spaniards | 16.3 /100 | #207 | Poor 20.5% |
| Dutch | 15.9 /100 | #208 | Poor 20.5% |