Immigrants from Germany vs Mexican Seniors Poverty Over the Age of 75
COMPARE
Immigrants from Germany
Mexican
Seniors Poverty Over the Age of 75
Seniors Poverty Over the Age of 75 Comparison
Immigrants from Germany
Mexicans
11.5%
SENIORS POVERTY OVER THE AGE OF 75
94.1/ 100
METRIC RATING
91st/ 347
METRIC RANK
14.4%
SENIORS POVERTY OVER THE AGE OF 75
0.0/ 100
METRIC RATING
272nd/ 347
METRIC RANK
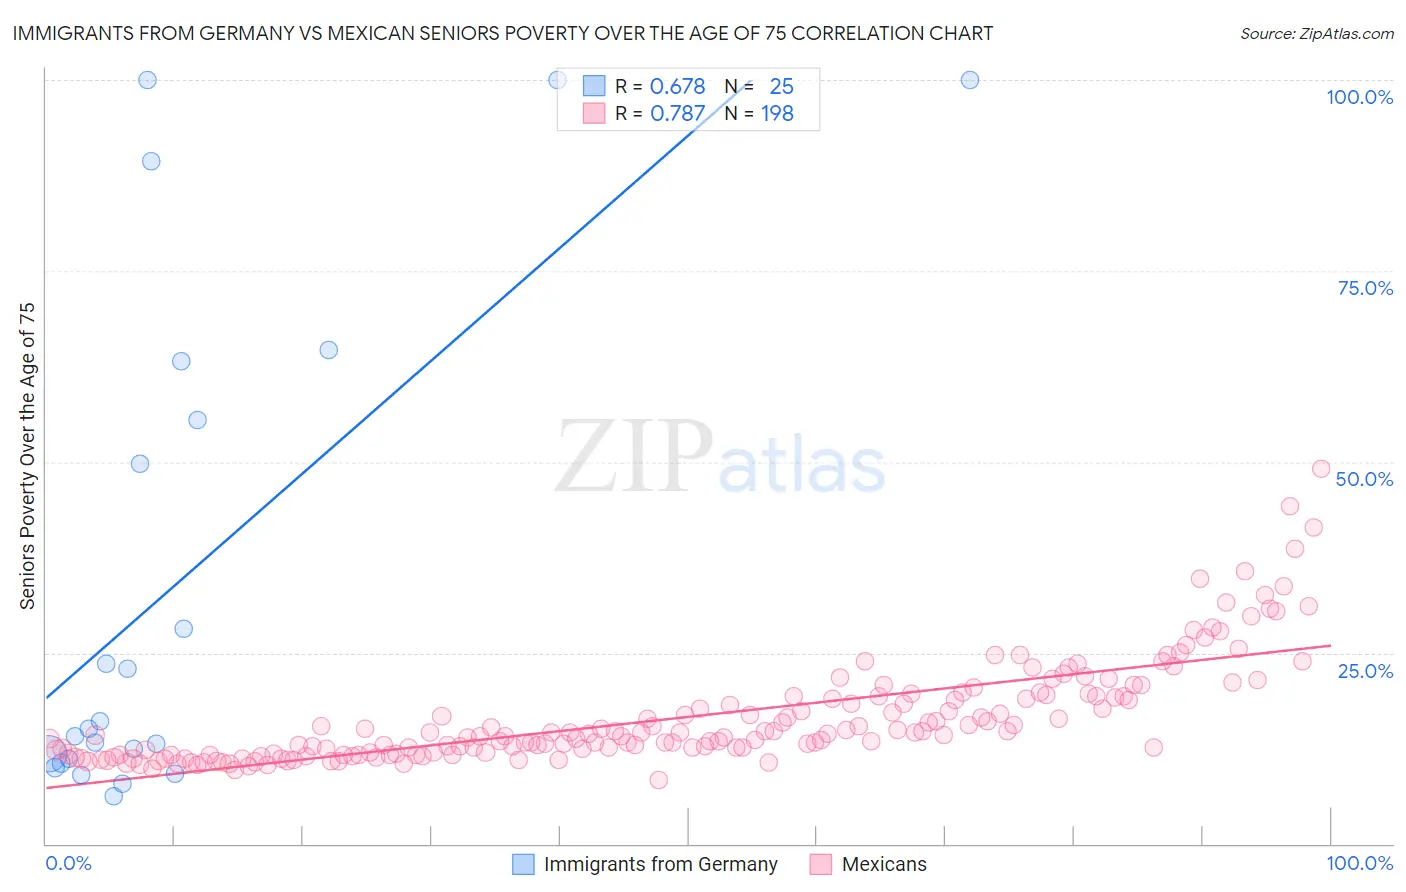
Immigrants from Germany vs Mexican Seniors Poverty Over the Age of 75 Correlation Chart
The statistical analysis conducted on geographies consisting of 457,232,902 people shows a significant positive correlation between the proportion of Immigrants from Germany and poverty level among seniors over the age of 75 in the United States with a correlation coefficient (R) of 0.678 and weighted average of 11.5%. Similarly, the statistical analysis conducted on geographies consisting of 549,837,754 people shows a strong positive correlation between the proportion of Mexicans and poverty level among seniors over the age of 75 in the United States with a correlation coefficient (R) of 0.787 and weighted average of 14.4%, a difference of 25.0%.
Seniors Poverty Over the Age of 75 Correlation Summary
| Measurement | Immigrants from Germany | Mexican |
| Minimum | 6.2% | 8.4% |
| Maximum | 100.0% | 49.0% |
| Range | 93.8% | 40.7% |
| Mean | 34.3% | 16.5% |
| Median | 15.1% | 14.3% |
| Interquartile 25% (IQ1) | 10.8% | 11.7% |
| Interquartile 75% (IQ3) | 59.4% | 19.3% |
| Interquartile Range (IQR) | 48.6% | 7.5% |
| Standard Deviation (Sample) | 33.0% | 6.8% |
| Standard Deviation (Population) | 32.3% | 6.8% |
Similar Demographics by Seniors Poverty Over the Age of 75
Demographics Similar to Immigrants from Germany by Seniors Poverty Over the Age of 75
In terms of seniors poverty over the age of 75, the demographic groups most similar to Immigrants from Germany are Aleut (11.5%, a difference of 0.020%), Kenyan (11.5%, a difference of 0.070%), Immigrants from Sri Lanka (11.5%, a difference of 0.13%), Immigrants from Croatia (11.5%, a difference of 0.16%), and Korean (11.5%, a difference of 0.18%).
| Demographics | Rating | Rank | Seniors Poverty Over the Age of 75 |
| Immigrants | Iraq | 94.9 /100 | #84 | Exceptional 11.5% |
| Immigrants | Bulgaria | 94.7 /100 | #85 | Exceptional 11.5% |
| Australians | 94.6 /100 | #86 | Exceptional 11.5% |
| Koreans | 94.5 /100 | #87 | Exceptional 11.5% |
| Immigrants | Croatia | 94.5 /100 | #88 | Exceptional 11.5% |
| Immigrants | Sri Lanka | 94.4 /100 | #89 | Exceptional 11.5% |
| Aleuts | 94.1 /100 | #90 | Exceptional 11.5% |
| Immigrants | Germany | 94.1 /100 | #91 | Exceptional 11.5% |
| Kenyans | 93.9 /100 | #92 | Exceptional 11.5% |
| Immigrants | Poland | 92.9 /100 | #93 | Exceptional 11.6% |
| Creek | 92.7 /100 | #94 | Exceptional 11.6% |
| Immigrants | Bosnia and Herzegovina | 92.6 /100 | #95 | Exceptional 11.6% |
| Immigrants | Sweden | 92.6 /100 | #96 | Exceptional 11.6% |
| Romanians | 92.3 /100 | #97 | Exceptional 11.6% |
| Immigrants | Japan | 91.9 /100 | #98 | Exceptional 11.6% |
Demographics Similar to Mexicans by Seniors Poverty Over the Age of 75
In terms of seniors poverty over the age of 75, the demographic groups most similar to Mexicans are Immigrants from Ghana (14.4%, a difference of 0.11%), Immigrants from South America (14.4%, a difference of 0.22%), Immigrants from Bahamas (14.4%, a difference of 0.39%), Immigrants from El Salvador (14.5%, a difference of 0.55%), and Immigrants from Uruguay (14.3%, a difference of 0.59%).
| Demographics | Rating | Rank | Seniors Poverty Over the Age of 75 |
| Salvadorans | 0.0 /100 | #265 | Tragic 14.2% |
| Armenians | 0.0 /100 | #266 | Tragic 14.2% |
| Venezuelans | 0.0 /100 | #267 | Tragic 14.2% |
| Colombians | 0.0 /100 | #268 | Tragic 14.3% |
| Immigrants | Venezuela | 0.0 /100 | #269 | Tragic 14.3% |
| Immigrants | Uruguay | 0.0 /100 | #270 | Tragic 14.3% |
| Immigrants | Ghana | 0.0 /100 | #271 | Tragic 14.4% |
| Mexicans | 0.0 /100 | #272 | Tragic 14.4% |
| Immigrants | South America | 0.0 /100 | #273 | Tragic 14.4% |
| Immigrants | Bahamas | 0.0 /100 | #274 | Tragic 14.4% |
| Immigrants | El Salvador | 0.0 /100 | #275 | Tragic 14.5% |
| Soviet Union | 0.0 /100 | #276 | Tragic 14.5% |
| Senegalese | 0.0 /100 | #277 | Tragic 14.5% |
| Immigrants | Colombia | 0.0 /100 | #278 | Tragic 14.6% |
| Blacks/African Americans | 0.0 /100 | #279 | Tragic 14.6% |