Burmese vs Hawaiian Female Poverty Among 18-24 Year Olds
COMPARE
Burmese
Hawaiian
Female Poverty Among 18-24 Year Olds
Female Poverty Among 18-24 Year Olds Comparison
Burmese
Hawaiians
18.9%
FEMALE POVERTY AMONG 18-24 YEAR OLDS
99.2/ 100
METRIC RATING
84th/ 347
METRIC RANK
18.7%
FEMALE POVERTY AMONG 18-24 YEAR OLDS
99.6/ 100
METRIC RATING
74th/ 347
METRIC RANK
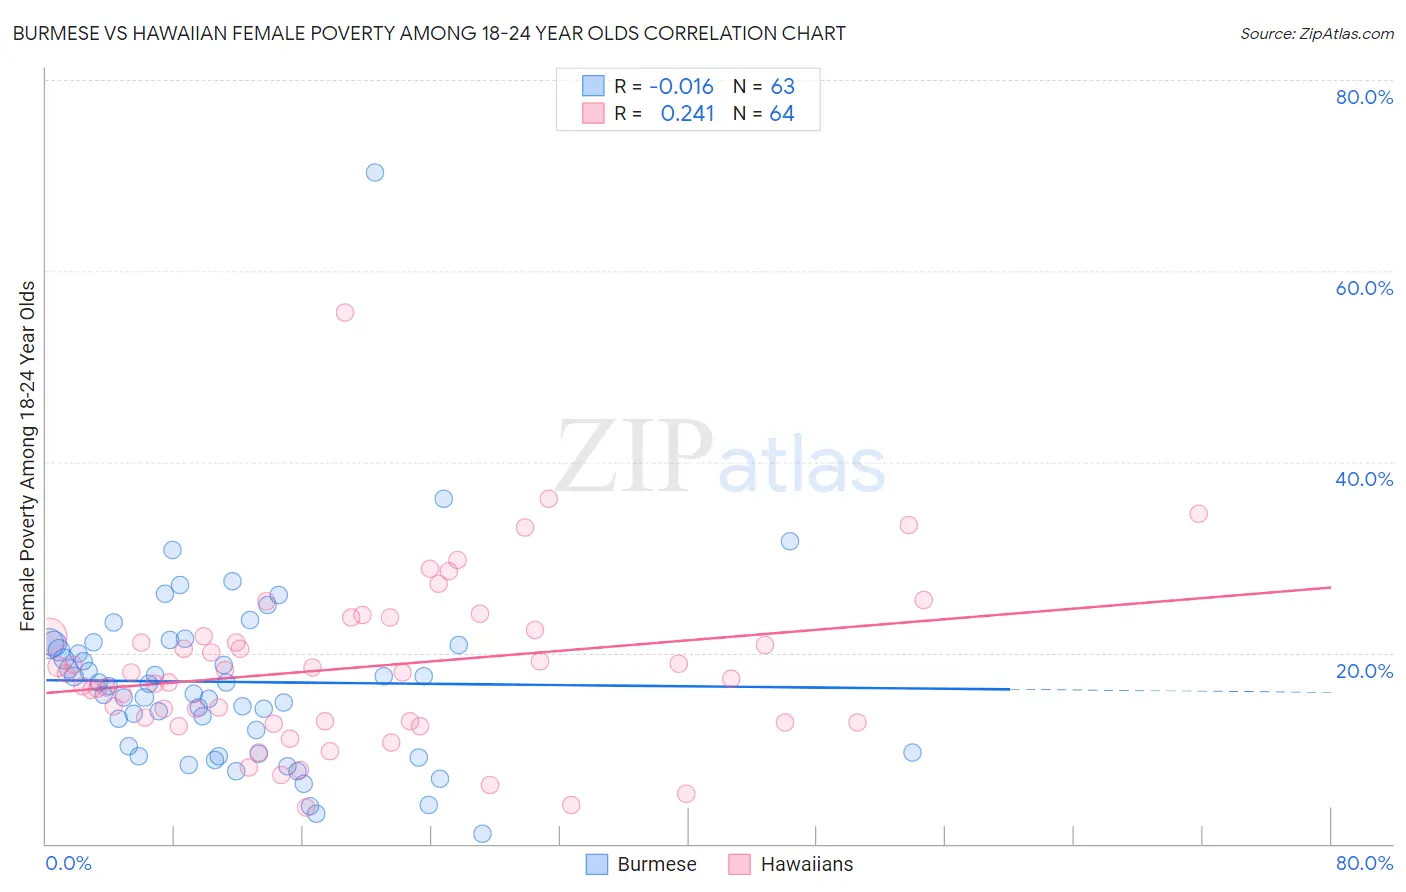
Burmese vs Hawaiian Female Poverty Among 18-24 Year Olds Correlation Chart
The statistical analysis conducted on geographies consisting of 450,126,497 people shows no correlation between the proportion of Burmese and poverty level among females between the ages 18 and 24 in the United States with a correlation coefficient (R) of -0.016 and weighted average of 18.9%. Similarly, the statistical analysis conducted on geographies consisting of 322,443,370 people shows a weak positive correlation between the proportion of Hawaiians and poverty level among females between the ages 18 and 24 in the United States with a correlation coefficient (R) of 0.241 and weighted average of 18.7%, a difference of 0.97%.
Female Poverty Among 18-24 Year Olds Correlation Summary
| Measurement | Burmese | Hawaiian |
| Minimum | 0.99% | 3.8% |
| Maximum | 70.3% | 55.6% |
| Range | 69.3% | 51.8% |
| Mean | 16.9% | 18.5% |
| Median | 16.5% | 17.9% |
| Interquartile 25% (IQ1) | 9.5% | 12.8% |
| Interquartile 75% (IQ3) | 21.0% | 22.0% |
| Interquartile Range (IQR) | 11.5% | 9.3% |
| Standard Deviation (Sample) | 9.9% | 8.8% |
| Standard Deviation (Population) | 9.9% | 8.7% |
Demographics Similar to Burmese and Hawaiians by Female Poverty Among 18-24 Year Olds
In terms of female poverty among 18-24 year olds, the demographic groups most similar to Burmese are Immigrants from Armenia (18.9%, a difference of 0.030%), Immigrants from Iraq (18.9%, a difference of 0.11%), Immigrants from Jamaica (18.9%, a difference of 0.12%), Croatian (19.0%, a difference of 0.27%), and Immigrants from Indonesia (18.9%, a difference of 0.29%). Similarly, the demographic groups most similar to Hawaiians are Lithuanian (18.7%, a difference of 0.19%), Polish (18.8%, a difference of 0.21%), Armenian (18.7%, a difference of 0.22%), Immigrants from Haiti (18.7%, a difference of 0.24%), and Immigrants from Cambodia (18.8%, a difference of 0.29%).
| Demographics | Rating | Rank | Female Poverty Among 18-24 Year Olds |
| Immigrants | Bulgaria | 99.7 /100 | #69 | Exceptional 18.6% |
| Immigrants | Costa Rica | 99.7 /100 | #70 | Exceptional 18.7% |
| Immigrants | Haiti | 99.7 /100 | #71 | Exceptional 18.7% |
| Armenians | 99.7 /100 | #72 | Exceptional 18.7% |
| Lithuanians | 99.7 /100 | #73 | Exceptional 18.7% |
| Hawaiians | 99.6 /100 | #74 | Exceptional 18.7% |
| Poles | 99.6 /100 | #75 | Exceptional 18.8% |
| Immigrants | Cambodia | 99.5 /100 | #76 | Exceptional 18.8% |
| Costa Ricans | 99.5 /100 | #77 | Exceptional 18.8% |
| Immigrants | Europe | 99.5 /100 | #78 | Exceptional 18.8% |
| Uruguayans | 99.5 /100 | #79 | Exceptional 18.8% |
| Palestinians | 99.5 /100 | #80 | Exceptional 18.8% |
| Japanese | 99.5 /100 | #81 | Exceptional 18.8% |
| Immigrants | Uruguay | 99.4 /100 | #82 | Exceptional 18.8% |
| Immigrants | Indonesia | 99.4 /100 | #83 | Exceptional 18.9% |
| Burmese | 99.2 /100 | #84 | Exceptional 18.9% |
| Immigrants | Armenia | 99.2 /100 | #85 | Exceptional 18.9% |
| Immigrants | Iraq | 99.2 /100 | #86 | Exceptional 18.9% |
| Immigrants | Jamaica | 99.2 /100 | #87 | Exceptional 18.9% |
| Croatians | 99.1 /100 | #88 | Exceptional 19.0% |
| Immigrants | Cabo Verde | 99.0 /100 | #89 | Exceptional 19.0% |