Immigrants from Micronesia vs Zimbabwean Male Poverty
COMPARE
Immigrants from Micronesia
Zimbabwean
Male Poverty
Male Poverty Comparison
Immigrants from Micronesia
Zimbabweans
12.2%
MALE POVERTY
2.1/ 100
METRIC RATING
223rd/ 347
METRIC RANK
10.2%
MALE POVERTY
97.5/ 100
METRIC RATING
65th/ 347
METRIC RANK
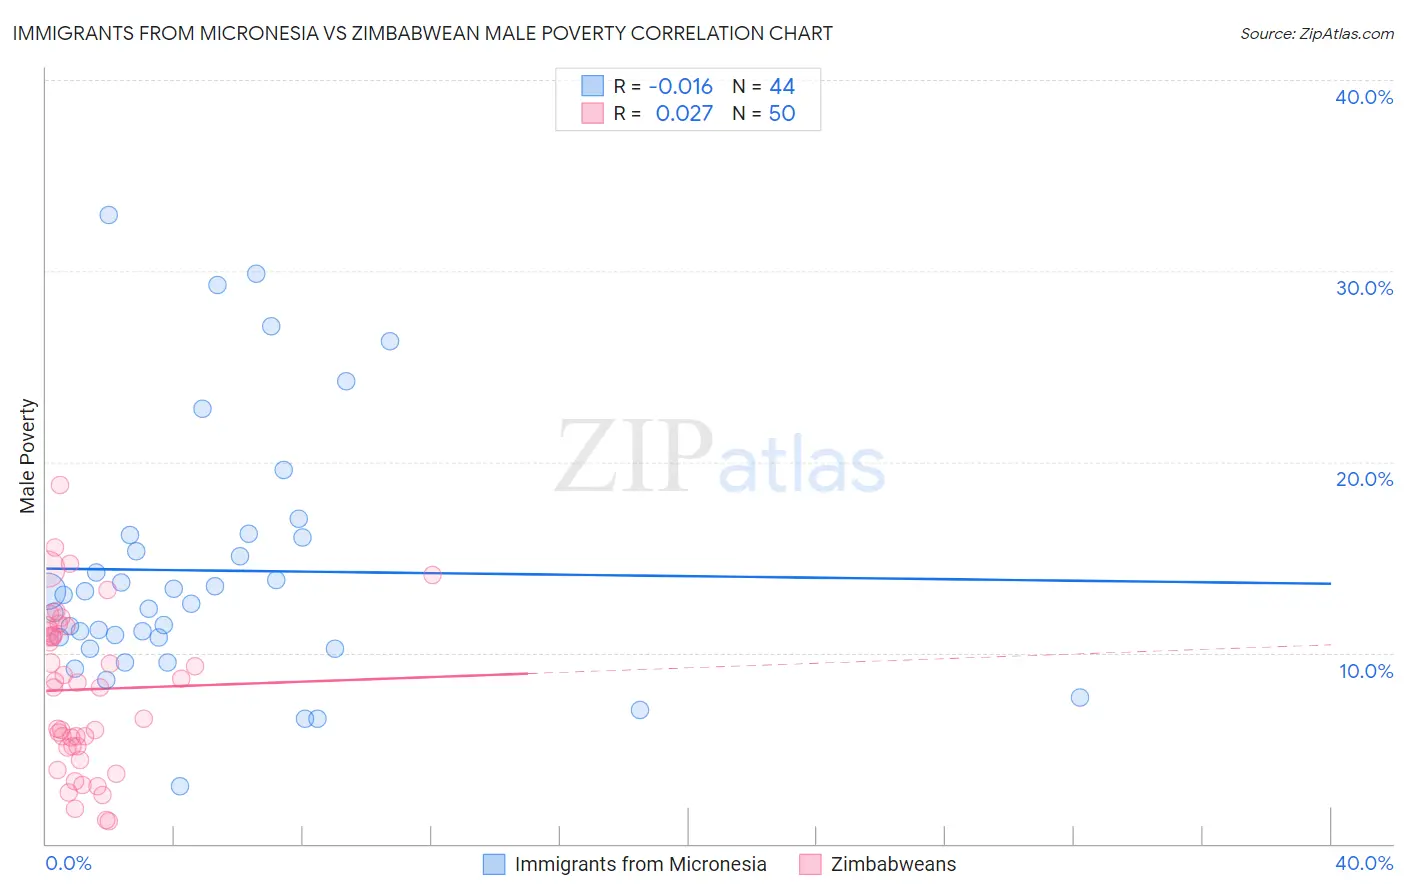
Immigrants from Micronesia vs Zimbabwean Male Poverty Correlation Chart
The statistical analysis conducted on geographies consisting of 61,601,312 people shows no correlation between the proportion of Immigrants from Micronesia and poverty level among males in the United States with a correlation coefficient (R) of -0.016 and weighted average of 12.2%. Similarly, the statistical analysis conducted on geographies consisting of 69,180,294 people shows no correlation between the proportion of Zimbabweans and poverty level among males in the United States with a correlation coefficient (R) of 0.027 and weighted average of 10.2%, a difference of 20.1%.
Male Poverty Correlation Summary
| Measurement | Immigrants from Micronesia | Zimbabwean |
| Minimum | 3.0% | 1.2% |
| Maximum | 32.9% | 18.8% |
| Range | 29.9% | 17.7% |
| Mean | 14.3% | 8.1% |
| Median | 12.8% | 8.3% |
| Interquartile 25% (IQ1) | 10.5% | 5.1% |
| Interquartile 75% (IQ3) | 16.1% | 11.1% |
| Interquartile Range (IQR) | 5.6% | 5.9% |
| Standard Deviation (Sample) | 6.7% | 4.1% |
| Standard Deviation (Population) | 6.6% | 4.1% |
Similar Demographics by Male Poverty
Demographics Similar to Immigrants from Micronesia by Male Poverty
In terms of male poverty, the demographic groups most similar to Immigrants from Micronesia are Immigrants from Africa (12.2%, a difference of 0.010%), Ugandan (12.2%, a difference of 0.040%), Immigrants from Eritrea (12.2%, a difference of 0.25%), Bermudan (12.2%, a difference of 0.26%), and German Russian (12.2%, a difference of 0.33%).
| Demographics | Rating | Rank | Male Poverty |
| Immigrants | Cambodia | 2.5 /100 | #216 | Tragic 12.2% |
| Immigrants | Thailand | 2.5 /100 | #217 | Tragic 12.2% |
| German Russians | 2.5 /100 | #218 | Tragic 12.2% |
| Bermudans | 2.4 /100 | #219 | Tragic 12.2% |
| Immigrants | Eritrea | 2.4 /100 | #220 | Tragic 12.2% |
| Ugandans | 2.2 /100 | #221 | Tragic 12.2% |
| Immigrants | Africa | 2.1 /100 | #222 | Tragic 12.2% |
| Immigrants | Micronesia | 2.1 /100 | #223 | Tragic 12.2% |
| Immigrants | Nigeria | 1.6 /100 | #224 | Tragic 12.3% |
| Osage | 1.5 /100 | #225 | Tragic 12.3% |
| Nigerians | 1.4 /100 | #226 | Tragic 12.3% |
| Alaska Natives | 1.4 /100 | #227 | Tragic 12.4% |
| Alsatians | 1.3 /100 | #228 | Tragic 12.4% |
| Cubans | 1.3 /100 | #229 | Tragic 12.4% |
| Marshallese | 0.8 /100 | #230 | Tragic 12.5% |
Demographics Similar to Zimbabweans by Male Poverty
In terms of male poverty, the demographic groups most similar to Zimbabweans are Serbian (10.2%, a difference of 0.010%), Swiss (10.2%, a difference of 0.070%), Immigrants from Netherlands (10.2%, a difference of 0.18%), Immigrants from Sri Lanka (10.2%, a difference of 0.24%), and Slovak (10.2%, a difference of 0.30%).
| Demographics | Rating | Rank | Male Poverty |
| Scandinavians | 98.0 /100 | #58 | Exceptional 10.1% |
| Immigrants | Europe | 97.9 /100 | #59 | Exceptional 10.1% |
| Ukrainians | 97.9 /100 | #60 | Exceptional 10.1% |
| Austrians | 97.8 /100 | #61 | Exceptional 10.1% |
| Immigrants | Italy | 97.8 /100 | #62 | Exceptional 10.2% |
| Slovaks | 97.7 /100 | #63 | Exceptional 10.2% |
| Swiss | 97.5 /100 | #64 | Exceptional 10.2% |
| Zimbabweans | 97.5 /100 | #65 | Exceptional 10.2% |
| Serbians | 97.5 /100 | #66 | Exceptional 10.2% |
| Immigrants | Netherlands | 97.3 /100 | #67 | Exceptional 10.2% |
| Immigrants | Sri Lanka | 97.2 /100 | #68 | Exceptional 10.2% |
| Immigrants | Australia | 97.1 /100 | #69 | Exceptional 10.2% |
| Paraguayans | 97.1 /100 | #70 | Exceptional 10.2% |
| Europeans | 97.1 /100 | #71 | Exceptional 10.2% |
| Immigrants | Canada | 97.1 /100 | #72 | Exceptional 10.2% |