Immigrants from Malaysia vs French Single Father Poverty
COMPARE
Immigrants from Malaysia
French
Single Father Poverty
Single Father Poverty Comparison
Immigrants from Malaysia
French
15.2%
SINGLE FATHER POVERTY
99.8/ 100
METRIC RATING
65th/ 347
METRIC RANK
18.2%
SINGLE FATHER POVERTY
0.0/ 100
METRIC RATING
297th/ 347
METRIC RANK
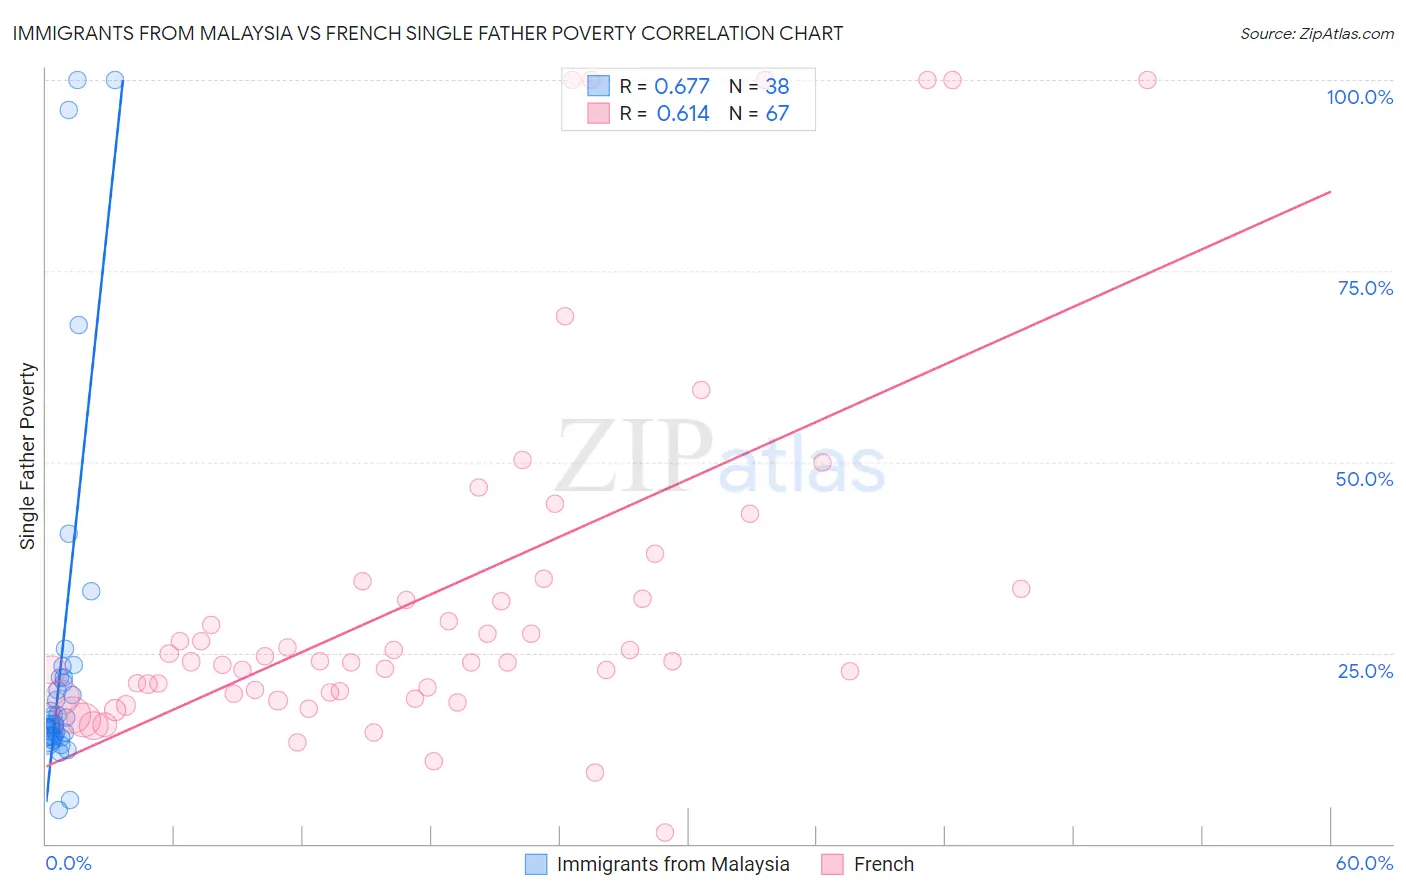
Immigrants from Malaysia vs French Single Father Poverty Correlation Chart
The statistical analysis conducted on geographies consisting of 167,066,405 people shows a significant positive correlation between the proportion of Immigrants from Malaysia and poverty level among single fathers in the United States with a correlation coefficient (R) of 0.677 and weighted average of 15.2%. Similarly, the statistical analysis conducted on geographies consisting of 409,472,161 people shows a significant positive correlation between the proportion of French and poverty level among single fathers in the United States with a correlation coefficient (R) of 0.614 and weighted average of 18.2%, a difference of 19.6%.
Single Father Poverty Correlation Summary
| Measurement | Immigrants from Malaysia | French |
| Minimum | 4.4% | 1.4% |
| Maximum | 100.0% | 100.0% |
| Range | 95.6% | 98.6% |
| Mean | 25.0% | 32.5% |
| Median | 16.4% | 23.8% |
| Interquartile 25% (IQ1) | 14.2% | 19.7% |
| Interquartile 75% (IQ3) | 21.7% | 33.3% |
| Interquartile Range (IQR) | 7.6% | 13.7% |
| Standard Deviation (Sample) | 24.2% | 24.1% |
| Standard Deviation (Population) | 23.9% | 23.9% |
Similar Demographics by Single Father Poverty
Demographics Similar to Immigrants from Malaysia by Single Father Poverty
In terms of single father poverty, the demographic groups most similar to Immigrants from Malaysia are Immigrants from Moldova (15.2%, a difference of 0.020%), Bangladeshi (15.2%, a difference of 0.090%), Paraguayan (15.2%, a difference of 0.11%), Immigrants from Sweden (15.2%, a difference of 0.16%), and Immigrants from Cameroon (15.2%, a difference of 0.20%).
| Demographics | Rating | Rank | Single Father Poverty |
| Hawaiians | 99.9 /100 | #58 | Exceptional 15.1% |
| Guamanians/Chamorros | 99.9 /100 | #59 | Exceptional 15.1% |
| Puget Sound Salish | 99.8 /100 | #60 | Exceptional 15.2% |
| Immigrants | Bosnia and Herzegovina | 99.8 /100 | #61 | Exceptional 15.2% |
| Immigrants | Armenia | 99.8 /100 | #62 | Exceptional 15.2% |
| Immigrants | Sweden | 99.8 /100 | #63 | Exceptional 15.2% |
| Bangladeshis | 99.8 /100 | #64 | Exceptional 15.2% |
| Immigrants | Malaysia | 99.8 /100 | #65 | Exceptional 15.2% |
| Immigrants | Moldova | 99.8 /100 | #66 | Exceptional 15.2% |
| Paraguayans | 99.7 /100 | #67 | Exceptional 15.2% |
| Immigrants | Cameroon | 99.7 /100 | #68 | Exceptional 15.2% |
| Japanese | 99.7 /100 | #69 | Exceptional 15.2% |
| Mongolians | 99.7 /100 | #70 | Exceptional 15.3% |
| Immigrants | Brazil | 99.6 /100 | #71 | Exceptional 15.3% |
| Immigrants | Lithuania | 99.6 /100 | #72 | Exceptional 15.3% |
Demographics Similar to French by Single Father Poverty
In terms of single father poverty, the demographic groups most similar to French are Seminole (18.1%, a difference of 0.21%), Yakama (18.1%, a difference of 0.31%), U.S. Virgin Islander (18.1%, a difference of 0.37%), Alaska Native (18.1%, a difference of 0.40%), and Immigrants from Bahamas (18.1%, a difference of 0.51%).
| Demographics | Rating | Rank | Single Father Poverty |
| West Indians | 0.0 /100 | #290 | Tragic 18.0% |
| Alaskan Athabascans | 0.0 /100 | #291 | Tragic 18.1% |
| Immigrants | Bahamas | 0.0 /100 | #292 | Tragic 18.1% |
| Alaska Natives | 0.0 /100 | #293 | Tragic 18.1% |
| U.S. Virgin Islanders | 0.0 /100 | #294 | Tragic 18.1% |
| Yakama | 0.0 /100 | #295 | Tragic 18.1% |
| Seminole | 0.0 /100 | #296 | Tragic 18.1% |
| French | 0.0 /100 | #297 | Tragic 18.2% |
| Africans | 0.0 /100 | #298 | Tragic 18.3% |
| Whites/Caucasians | 0.0 /100 | #299 | Tragic 18.4% |
| Immigrants | Dominican Republic | 0.0 /100 | #300 | Tragic 18.4% |
| Hungarians | 0.0 /100 | #301 | Tragic 18.5% |
| Comanche | 0.0 /100 | #302 | Tragic 18.5% |
| Celtics | 0.0 /100 | #303 | Tragic 18.5% |
| Ute | 0.0 /100 | #304 | Tragic 18.5% |