Spanish American vs French Single Father Poverty
COMPARE
Spanish American
French
Single Father Poverty
Single Father Poverty Comparison
Spanish Americans
French
16.9%
SINGLE FATHER POVERTY
3.7/ 100
METRIC RATING
231st/ 347
METRIC RANK
18.2%
SINGLE FATHER POVERTY
0.0/ 100
METRIC RATING
297th/ 347
METRIC RANK
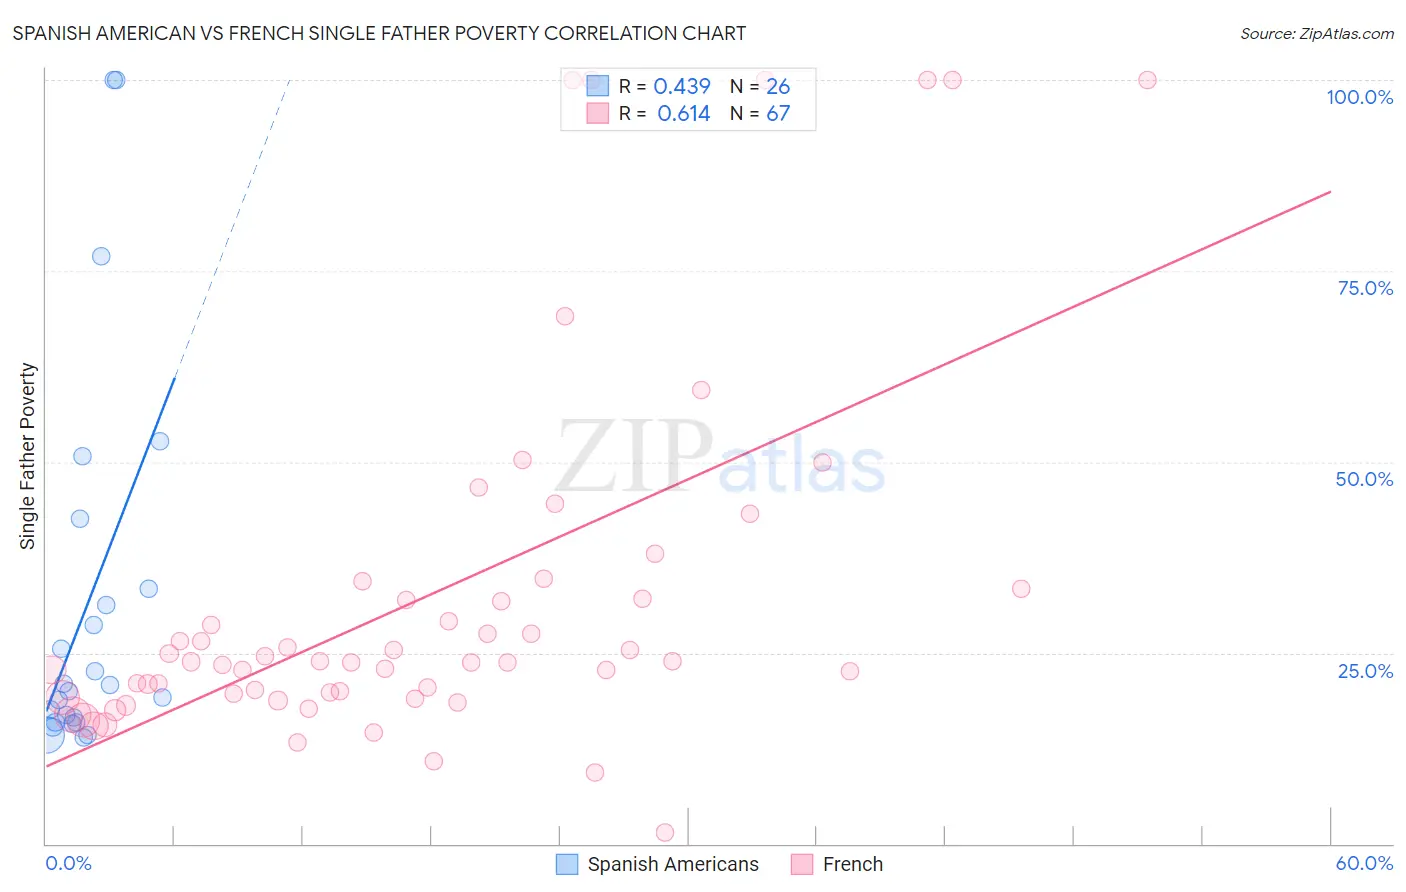
Spanish American vs French Single Father Poverty Correlation Chart
The statistical analysis conducted on geographies consisting of 95,172,668 people shows a moderate positive correlation between the proportion of Spanish Americans and poverty level among single fathers in the United States with a correlation coefficient (R) of 0.439 and weighted average of 16.9%. Similarly, the statistical analysis conducted on geographies consisting of 409,472,161 people shows a significant positive correlation between the proportion of French and poverty level among single fathers in the United States with a correlation coefficient (R) of 0.614 and weighted average of 18.2%, a difference of 7.7%.
Single Father Poverty Correlation Summary
| Measurement | Spanish American | French |
| Minimum | 13.9% | 1.4% |
| Maximum | 100.0% | 100.0% |
| Range | 86.1% | 98.6% |
| Mean | 31.5% | 32.5% |
| Median | 20.4% | 23.8% |
| Interquartile 25% (IQ1) | 15.9% | 19.7% |
| Interquartile 75% (IQ3) | 33.3% | 33.3% |
| Interquartile Range (IQR) | 17.4% | 13.7% |
| Standard Deviation (Sample) | 25.1% | 24.1% |
| Standard Deviation (Population) | 24.6% | 23.9% |
Similar Demographics by Single Father Poverty
Demographics Similar to Spanish Americans by Single Father Poverty
In terms of single father poverty, the demographic groups most similar to Spanish Americans are Immigrants from Grenada (16.9%, a difference of 0.020%), Senegalese (16.9%, a difference of 0.16%), Marshallese (16.9%, a difference of 0.19%), Immigrants from Trinidad and Tobago (16.8%, a difference of 0.21%), and Israeli (16.8%, a difference of 0.24%).
| Demographics | Rating | Rank | Single Father Poverty |
| Immigrants | Norway | 6.5 /100 | #224 | Tragic 16.8% |
| Menominee | 6.4 /100 | #225 | Tragic 16.8% |
| Hispanics or Latinos | 6.1 /100 | #226 | Tragic 16.8% |
| British | 5.6 /100 | #227 | Tragic 16.8% |
| Belgians | 5.3 /100 | #228 | Tragic 16.8% |
| Israelis | 4.6 /100 | #229 | Tragic 16.8% |
| Immigrants | Trinidad and Tobago | 4.5 /100 | #230 | Tragic 16.8% |
| Spanish Americans | 3.7 /100 | #231 | Tragic 16.9% |
| Immigrants | Grenada | 3.7 /100 | #232 | Tragic 16.9% |
| Senegalese | 3.2 /100 | #233 | Tragic 16.9% |
| Marshallese | 3.1 /100 | #234 | Tragic 16.9% |
| Immigrants | Western Europe | 2.9 /100 | #235 | Tragic 16.9% |
| Immigrants | Germany | 2.9 /100 | #236 | Tragic 16.9% |
| Sub-Saharan Africans | 2.9 /100 | #237 | Tragic 16.9% |
| Immigrants | Saudi Arabia | 2.7 /100 | #238 | Tragic 16.9% |
Demographics Similar to French by Single Father Poverty
In terms of single father poverty, the demographic groups most similar to French are Seminole (18.1%, a difference of 0.21%), Yakama (18.1%, a difference of 0.31%), U.S. Virgin Islander (18.1%, a difference of 0.37%), Alaska Native (18.1%, a difference of 0.40%), and Immigrants from Bahamas (18.1%, a difference of 0.51%).
| Demographics | Rating | Rank | Single Father Poverty |
| West Indians | 0.0 /100 | #290 | Tragic 18.0% |
| Alaskan Athabascans | 0.0 /100 | #291 | Tragic 18.1% |
| Immigrants | Bahamas | 0.0 /100 | #292 | Tragic 18.1% |
| Alaska Natives | 0.0 /100 | #293 | Tragic 18.1% |
| U.S. Virgin Islanders | 0.0 /100 | #294 | Tragic 18.1% |
| Yakama | 0.0 /100 | #295 | Tragic 18.1% |
| Seminole | 0.0 /100 | #296 | Tragic 18.1% |
| French | 0.0 /100 | #297 | Tragic 18.2% |
| Africans | 0.0 /100 | #298 | Tragic 18.3% |
| Whites/Caucasians | 0.0 /100 | #299 | Tragic 18.4% |
| Immigrants | Dominican Republic | 0.0 /100 | #300 | Tragic 18.4% |
| Hungarians | 0.0 /100 | #301 | Tragic 18.5% |
| Comanche | 0.0 /100 | #302 | Tragic 18.5% |
| Celtics | 0.0 /100 | #303 | Tragic 18.5% |
| Ute | 0.0 /100 | #304 | Tragic 18.5% |