Immigrants from Lithuania vs Irish Unemployment Among Seniors over 65 years
COMPARE
Immigrants from Lithuania
Irish
Unemployment Among Seniors over 65 years
Unemployment Among Seniors over 65 years Comparison
Immigrants from Lithuania
Irish
5.0%
UNEMPLOYMENT AMONG SENIORS OVER 65 YEARS
95.1/ 100
METRIC RATING
103rd/ 347
METRIC RANK
5.1%
UNEMPLOYMENT AMONG SENIORS OVER 65 YEARS
88.8/ 100
METRIC RATING
120th/ 347
METRIC RANK
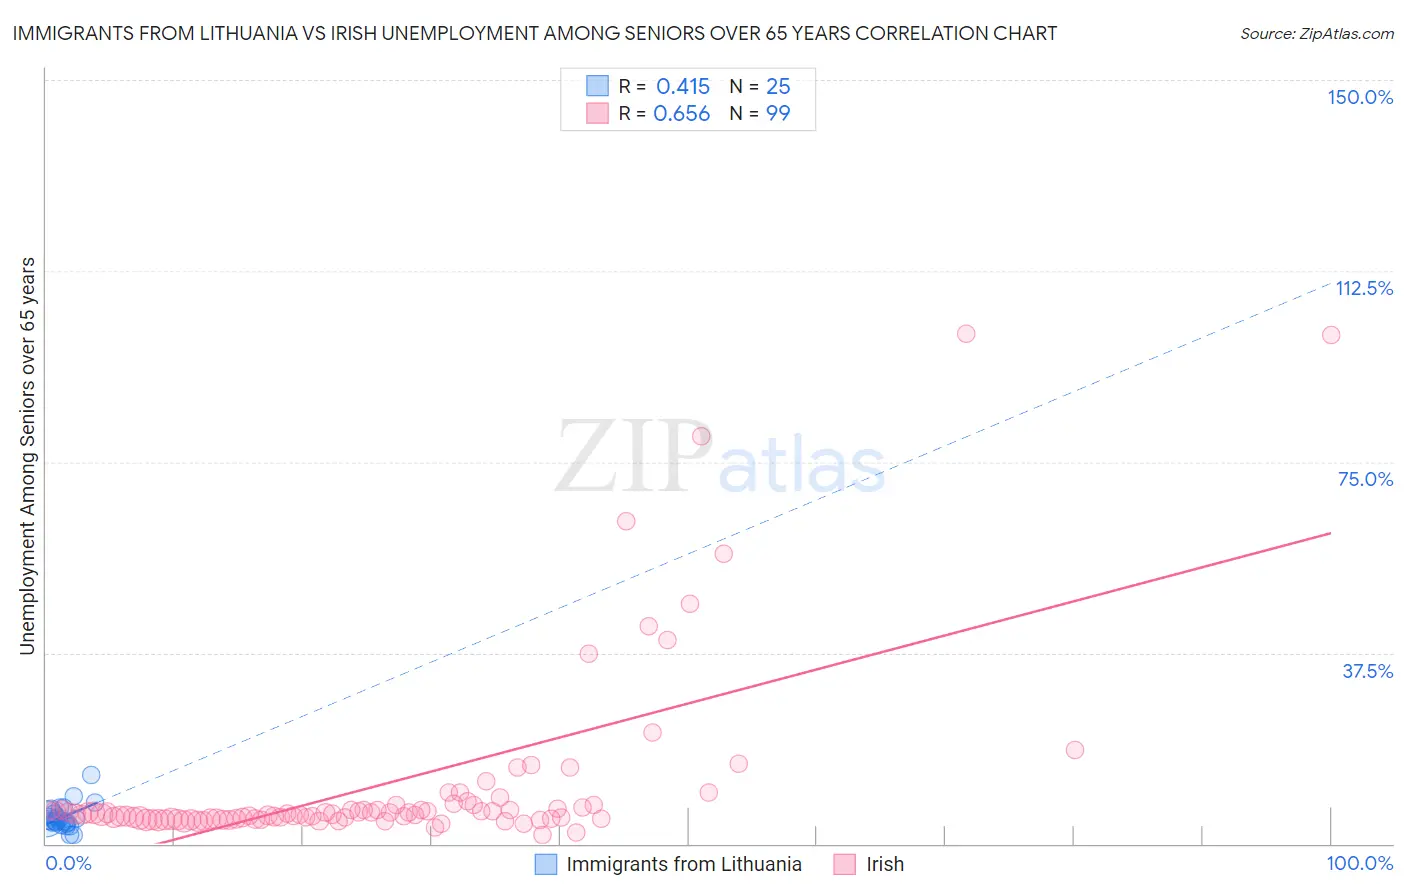
Immigrants from Lithuania vs Irish Unemployment Among Seniors over 65 years Correlation Chart
The statistical analysis conducted on geographies consisting of 113,554,800 people shows a moderate positive correlation between the proportion of Immigrants from Lithuania and unemployment rate amomg seniors over the age of 65 in the United States with a correlation coefficient (R) of 0.415 and weighted average of 5.0%. Similarly, the statistical analysis conducted on geographies consisting of 463,850,223 people shows a significant positive correlation between the proportion of Irish and unemployment rate amomg seniors over the age of 65 in the United States with a correlation coefficient (R) of 0.656 and weighted average of 5.1%, a difference of 0.74%.
Unemployment Among Seniors over 65 years Correlation Summary
| Measurement | Immigrants from Lithuania | Irish |
| Minimum | 1.7% | 1.8% |
| Maximum | 13.6% | 100.1% |
| Range | 11.9% | 98.3% |
| Mean | 5.2% | 11.6% |
| Median | 4.6% | 5.8% |
| Interquartile 25% (IQ1) | 4.0% | 4.8% |
| Interquartile 75% (IQ3) | 6.3% | 7.6% |
| Interquartile Range (IQR) | 2.3% | 2.7% |
| Standard Deviation (Sample) | 2.5% | 18.1% |
| Standard Deviation (Population) | 2.4% | 18.0% |
Demographics Similar to Immigrants from Lithuania and Irish by Unemployment Among Seniors over 65 years
In terms of unemployment among seniors over 65 years, the demographic groups most similar to Immigrants from Lithuania are Immigrants from Scotland (5.0%, a difference of 0.020%), Immigrants from Thailand (5.0%, a difference of 0.050%), Yugoslavian (5.0%, a difference of 0.060%), Okinawan (5.0%, a difference of 0.070%), and Immigrants from Turkey (5.0%, a difference of 0.13%). Similarly, the demographic groups most similar to Irish are Puget Sound Salish (5.1%, a difference of 0.010%), Immigrants from Canada (5.1%, a difference of 0.080%), Soviet Union (5.1%, a difference of 0.12%), Malaysian (5.1%, a difference of 0.15%), and Immigrants from Korea (5.0%, a difference of 0.20%).
| Demographics | Rating | Rank | Unemployment Among Seniors over 65 years |
| Yugoslavians | 95.4 /100 | #101 | Exceptional 5.0% |
| Immigrants | Thailand | 95.4 /100 | #102 | Exceptional 5.0% |
| Immigrants | Lithuania | 95.1 /100 | #103 | Exceptional 5.0% |
| Immigrants | Scotland | 95.0 /100 | #104 | Exceptional 5.0% |
| Okinawans | 94.7 /100 | #105 | Exceptional 5.0% |
| Immigrants | Turkey | 94.3 /100 | #106 | Exceptional 5.0% |
| Immigrants | Germany | 93.2 /100 | #107 | Exceptional 5.0% |
| Immigrants | Vietnam | 92.9 /100 | #108 | Exceptional 5.0% |
| Immigrants | Malaysia | 92.7 /100 | #109 | Exceptional 5.0% |
| Immigrants | Saudi Arabia | 92.7 /100 | #110 | Exceptional 5.0% |
| Finns | 92.2 /100 | #111 | Exceptional 5.0% |
| Eastern Europeans | 92.0 /100 | #112 | Exceptional 5.0% |
| Seminole | 91.4 /100 | #113 | Exceptional 5.0% |
| Immigrants | Latvia | 91.4 /100 | #114 | Exceptional 5.0% |
| Celtics | 91.3 /100 | #115 | Exceptional 5.0% |
| Immigrants | Korea | 91.0 /100 | #116 | Exceptional 5.0% |
| Malaysians | 90.4 /100 | #117 | Exceptional 5.1% |
| Soviet Union | 90.1 /100 | #118 | Exceptional 5.1% |
| Immigrants | Canada | 89.7 /100 | #119 | Excellent 5.1% |
| Irish | 88.8 /100 | #120 | Excellent 5.1% |
| Puget Sound Salish | 88.7 /100 | #121 | Excellent 5.1% |