Immigrants from Korea vs Scotch-Irish Child Poverty Under the Age of 5
COMPARE
Immigrants from Korea
Scotch-Irish
Child Poverty Under the Age of 5
Child Poverty Under the Age of 5 Comparison
Immigrants from Korea
Scotch-Irish
13.2%
CHILD POVERTY UNDER THE AGE OF 5
100.0/ 100
METRIC RATING
11th/ 347
METRIC RANK
18.2%
CHILD POVERTY UNDER THE AGE OF 5
9.8/ 100
METRIC RATING
208th/ 347
METRIC RANK
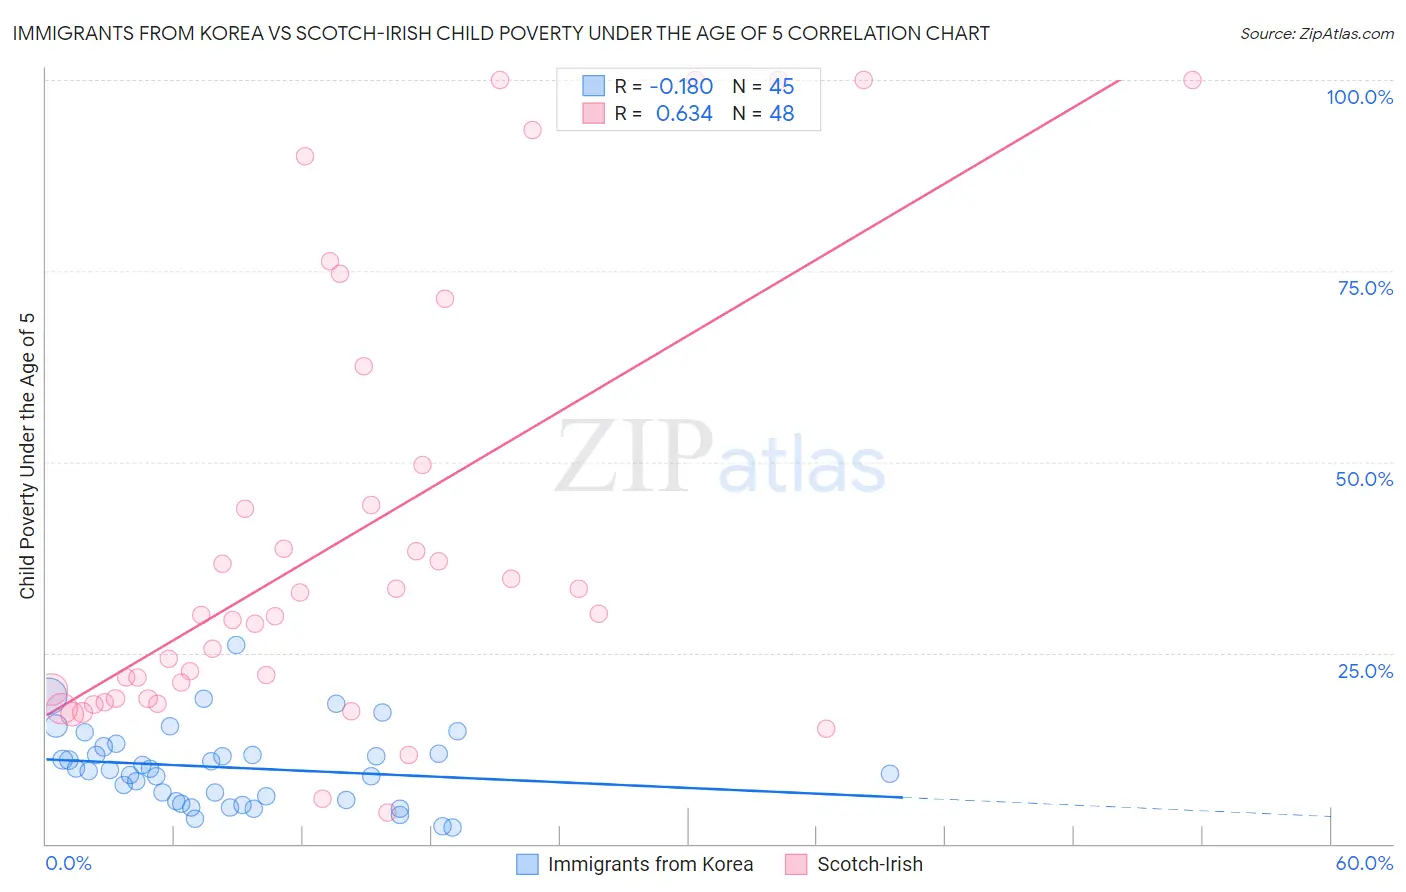
Immigrants from Korea vs Scotch-Irish Child Poverty Under the Age of 5 Correlation Chart
The statistical analysis conducted on geographies consisting of 396,775,886 people shows a poor negative correlation between the proportion of Immigrants from Korea and poverty level among children under the age of 5 in the United States with a correlation coefficient (R) of -0.180 and weighted average of 13.2%. Similarly, the statistical analysis conducted on geographies consisting of 512,287,895 people shows a significant positive correlation between the proportion of Scotch-Irish and poverty level among children under the age of 5 in the United States with a correlation coefficient (R) of 0.634 and weighted average of 18.2%, a difference of 37.6%.
Child Poverty Under the Age of 5 Correlation Summary
| Measurement | Immigrants from Korea | Scotch-Irish |
| Minimum | 2.2% | 4.1% |
| Maximum | 26.0% | 100.0% |
| Range | 23.8% | 95.9% |
| Mean | 10.0% | 39.9% |
| Median | 9.6% | 29.9% |
| Interquartile 25% (IQ1) | 5.6% | 19.0% |
| Interquartile 75% (IQ3) | 12.3% | 47.0% |
| Interquartile Range (IQR) | 6.7% | 28.1% |
| Standard Deviation (Sample) | 5.1% | 28.8% |
| Standard Deviation (Population) | 5.0% | 28.5% |
Similar Demographics by Child Poverty Under the Age of 5
Demographics Similar to Immigrants from Korea by Child Poverty Under the Age of 5
In terms of child poverty under the age of 5, the demographic groups most similar to Immigrants from Korea are Immigrants from South Central Asia (13.3%, a difference of 0.10%), Burmese (13.2%, a difference of 0.11%), Bhutanese (13.4%, a difference of 0.86%), Immigrants from Iran (13.1%, a difference of 1.2%), and Iranian (13.1%, a difference of 1.4%).
| Demographics | Rating | Rank | Child Poverty Under the Age of 5 |
| Thais | 100.0 /100 | #4 | Exceptional 12.3% |
| Immigrants | Hong Kong | 100.0 /100 | #5 | Exceptional 12.4% |
| Immigrants | Singapore | 100.0 /100 | #6 | Exceptional 12.9% |
| Chinese | 100.0 /100 | #7 | Exceptional 13.1% |
| Iranians | 100.0 /100 | #8 | Exceptional 13.1% |
| Immigrants | Iran | 100.0 /100 | #9 | Exceptional 13.1% |
| Burmese | 100.0 /100 | #10 | Exceptional 13.2% |
| Immigrants | Korea | 100.0 /100 | #11 | Exceptional 13.2% |
| Immigrants | South Central Asia | 100.0 /100 | #12 | Exceptional 13.3% |
| Bhutanese | 100.0 /100 | #13 | Exceptional 13.4% |
| Okinawans | 100.0 /100 | #14 | Exceptional 13.4% |
| Indians (Asian) | 100.0 /100 | #15 | Exceptional 13.4% |
| Immigrants | Eastern Asia | 100.0 /100 | #16 | Exceptional 13.5% |
| Assyrians/Chaldeans/Syriacs | 100.0 /100 | #17 | Exceptional 13.6% |
| Immigrants | China | 100.0 /100 | #18 | Exceptional 13.6% |
Demographics Similar to Scotch-Irish by Child Poverty Under the Age of 5
In terms of child poverty under the age of 5, the demographic groups most similar to Scotch-Irish are Spanish (18.2%, a difference of 0.010%), Immigrants (18.2%, a difference of 0.020%), Panamanian (18.2%, a difference of 0.020%), Moroccan (18.2%, a difference of 0.11%), and Nepalese (18.3%, a difference of 0.32%).
| Demographics | Rating | Rank | Child Poverty Under the Age of 5 |
| Ugandans | 13.9 /100 | #201 | Poor 18.0% |
| Japanese | 13.8 /100 | #202 | Poor 18.1% |
| Immigrants | Cambodia | 13.7 /100 | #203 | Poor 18.1% |
| Immigrants | Eastern Africa | 13.4 /100 | #204 | Poor 18.1% |
| Spaniards | 12.8 /100 | #205 | Poor 18.1% |
| Whites/Caucasians | 12.6 /100 | #206 | Poor 18.1% |
| Immigrants | Immigrants | 9.9 /100 | #207 | Tragic 18.2% |
| Scotch-Irish | 9.8 /100 | #208 | Tragic 18.2% |
| Spanish | 9.8 /100 | #209 | Tragic 18.2% |
| Panamanians | 9.7 /100 | #210 | Tragic 18.2% |
| Moroccans | 9.4 /100 | #211 | Tragic 18.2% |
| Nepalese | 8.7 /100 | #212 | Tragic 18.3% |
| Immigrants | Thailand | 8.6 /100 | #213 | Tragic 18.3% |
| Malaysians | 6.5 /100 | #214 | Tragic 18.4% |
| Immigrants | Panama | 6.0 /100 | #215 | Tragic 18.5% |