Immigrants from Kenya vs Yup'ik Seniors Poverty Over the Age of 75
COMPARE
Immigrants from Kenya
Yup'ik
Seniors Poverty Over the Age of 75
Seniors Poverty Over the Age of 75 Comparison
Immigrants from Kenya
Yup'ik
11.9%
SENIORS POVERTY OVER THE AGE OF 75
72.6/ 100
METRIC RATING
139th/ 347
METRIC RANK
15.8%
SENIORS POVERTY OVER THE AGE OF 75
0.0/ 100
METRIC RATING
309th/ 347
METRIC RANK
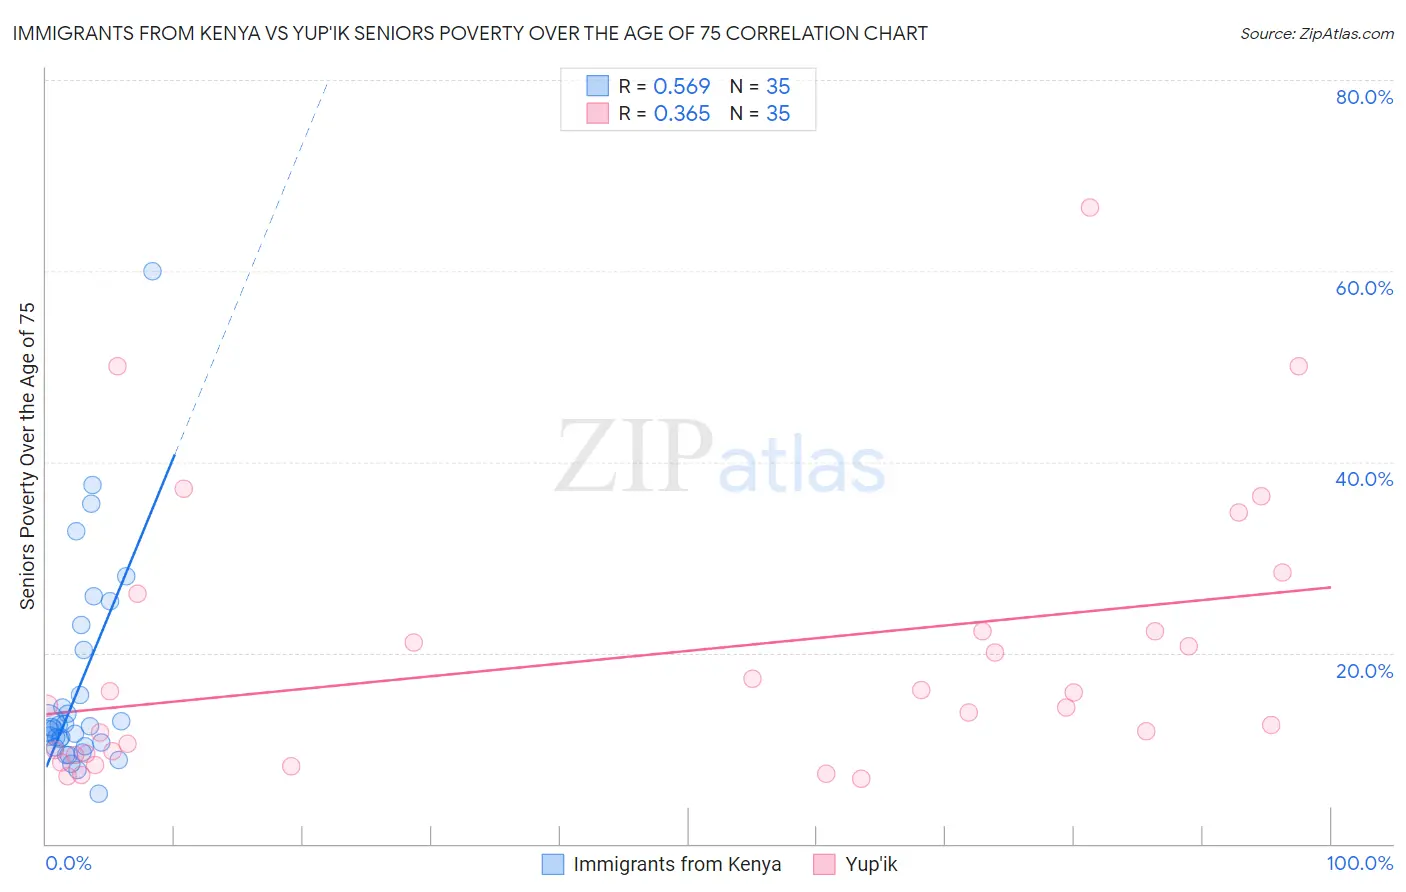
Immigrants from Kenya vs Yup'ik Seniors Poverty Over the Age of 75 Correlation Chart
The statistical analysis conducted on geographies consisting of 216,694,487 people shows a substantial positive correlation between the proportion of Immigrants from Kenya and poverty level among seniors over the age of 75 in the United States with a correlation coefficient (R) of 0.569 and weighted average of 11.9%. Similarly, the statistical analysis conducted on geographies consisting of 39,739,861 people shows a mild positive correlation between the proportion of Yup'ik and poverty level among seniors over the age of 75 in the United States with a correlation coefficient (R) of 0.365 and weighted average of 15.8%, a difference of 32.6%.
Seniors Poverty Over the Age of 75 Correlation Summary
| Measurement | Immigrants from Kenya | Yup'ik |
| Minimum | 5.3% | 6.8% |
| Maximum | 60.0% | 66.7% |
| Range | 54.7% | 59.9% |
| Mean | 16.5% | 19.5% |
| Median | 12.2% | 14.4% |
| Interquartile 25% (IQ1) | 10.2% | 9.4% |
| Interquartile 75% (IQ3) | 20.3% | 22.2% |
| Interquartile Range (IQR) | 10.1% | 12.8% |
| Standard Deviation (Sample) | 11.1% | 14.2% |
| Standard Deviation (Population) | 11.0% | 14.0% |
Similar Demographics by Seniors Poverty Over the Age of 75
Demographics Similar to Immigrants from Kenya by Seniors Poverty Over the Age of 75
In terms of seniors poverty over the age of 75, the demographic groups most similar to Immigrants from Kenya are Immigrants from Romania (11.9%, a difference of 0.010%), Immigrants from Pakistan (12.0%, a difference of 0.070%), Immigrants from Cameroon (12.0%, a difference of 0.080%), Immigrants from Laos (12.0%, a difference of 0.11%), and American (12.0%, a difference of 0.16%).
| Demographics | Rating | Rank | Seniors Poverty Over the Age of 75 |
| Lebanese | 78.3 /100 | #132 | Good 11.9% |
| Immigrants | Sierra Leone | 77.6 /100 | #133 | Good 11.9% |
| Ugandans | 77.1 /100 | #134 | Good 11.9% |
| Immigrants | Ireland | 76.2 /100 | #135 | Good 11.9% |
| Immigrants | Philippines | 75.0 /100 | #136 | Good 11.9% |
| Immigrants | Moldova | 74.1 /100 | #137 | Good 11.9% |
| Immigrants | Romania | 72.6 /100 | #138 | Good 11.9% |
| Immigrants | Kenya | 72.6 /100 | #139 | Good 11.9% |
| Immigrants | Pakistan | 71.9 /100 | #140 | Good 12.0% |
| Immigrants | Cameroon | 71.7 /100 | #141 | Good 12.0% |
| Immigrants | Laos | 71.5 /100 | #142 | Good 12.0% |
| Americans | 71.0 /100 | #143 | Good 12.0% |
| Hmong | 70.8 /100 | #144 | Good 12.0% |
| Immigrants | Belgium | 70.8 /100 | #145 | Good 12.0% |
| Bangladeshis | 70.4 /100 | #146 | Good 12.0% |
Demographics Similar to Yup'ik by Seniors Poverty Over the Age of 75
In terms of seniors poverty over the age of 75, the demographic groups most similar to Yup'ik are Vietnamese (15.9%, a difference of 0.10%), Trinidadian and Tobagonian (15.9%, a difference of 0.20%), Immigrants from Bangladesh (15.8%, a difference of 0.30%), Immigrants from West Indies (15.8%, a difference of 0.34%), and Hispanic or Latino (15.8%, a difference of 0.48%).
| Demographics | Rating | Rank | Seniors Poverty Over the Age of 75 |
| West Indians | 0.0 /100 | #302 | Tragic 15.7% |
| Immigrants | Honduras | 0.0 /100 | #303 | Tragic 15.7% |
| Immigrants | Trinidad and Tobago | 0.0 /100 | #304 | Tragic 15.7% |
| Ecuadorians | 0.0 /100 | #305 | Tragic 15.7% |
| Hispanics or Latinos | 0.0 /100 | #306 | Tragic 15.8% |
| Immigrants | West Indies | 0.0 /100 | #307 | Tragic 15.8% |
| Immigrants | Bangladesh | 0.0 /100 | #308 | Tragic 15.8% |
| Yup'ik | 0.0 /100 | #309 | Tragic 15.8% |
| Vietnamese | 0.0 /100 | #310 | Tragic 15.9% |
| Trinidadians and Tobagonians | 0.0 /100 | #311 | Tragic 15.9% |
| Crow | 0.0 /100 | #312 | Tragic 15.9% |
| Barbadians | 0.0 /100 | #313 | Tragic 16.0% |
| Tsimshian | 0.0 /100 | #314 | Tragic 16.1% |
| Guyanese | 0.0 /100 | #315 | Tragic 16.1% |
| Immigrants | Ecuador | 0.0 /100 | #316 | Tragic 16.1% |