Haitian vs Yup'ik Seniors Poverty Over the Age of 75
COMPARE
Haitian
Yup'ik
Seniors Poverty Over the Age of 75
Seniors Poverty Over the Age of 75 Comparison
Haitians
Yup'ik
16.2%
SENIORS POVERTY OVER THE AGE OF 75
0.0/ 100
METRIC RATING
319th/ 347
METRIC RANK
15.8%
SENIORS POVERTY OVER THE AGE OF 75
0.0/ 100
METRIC RATING
309th/ 347
METRIC RANK
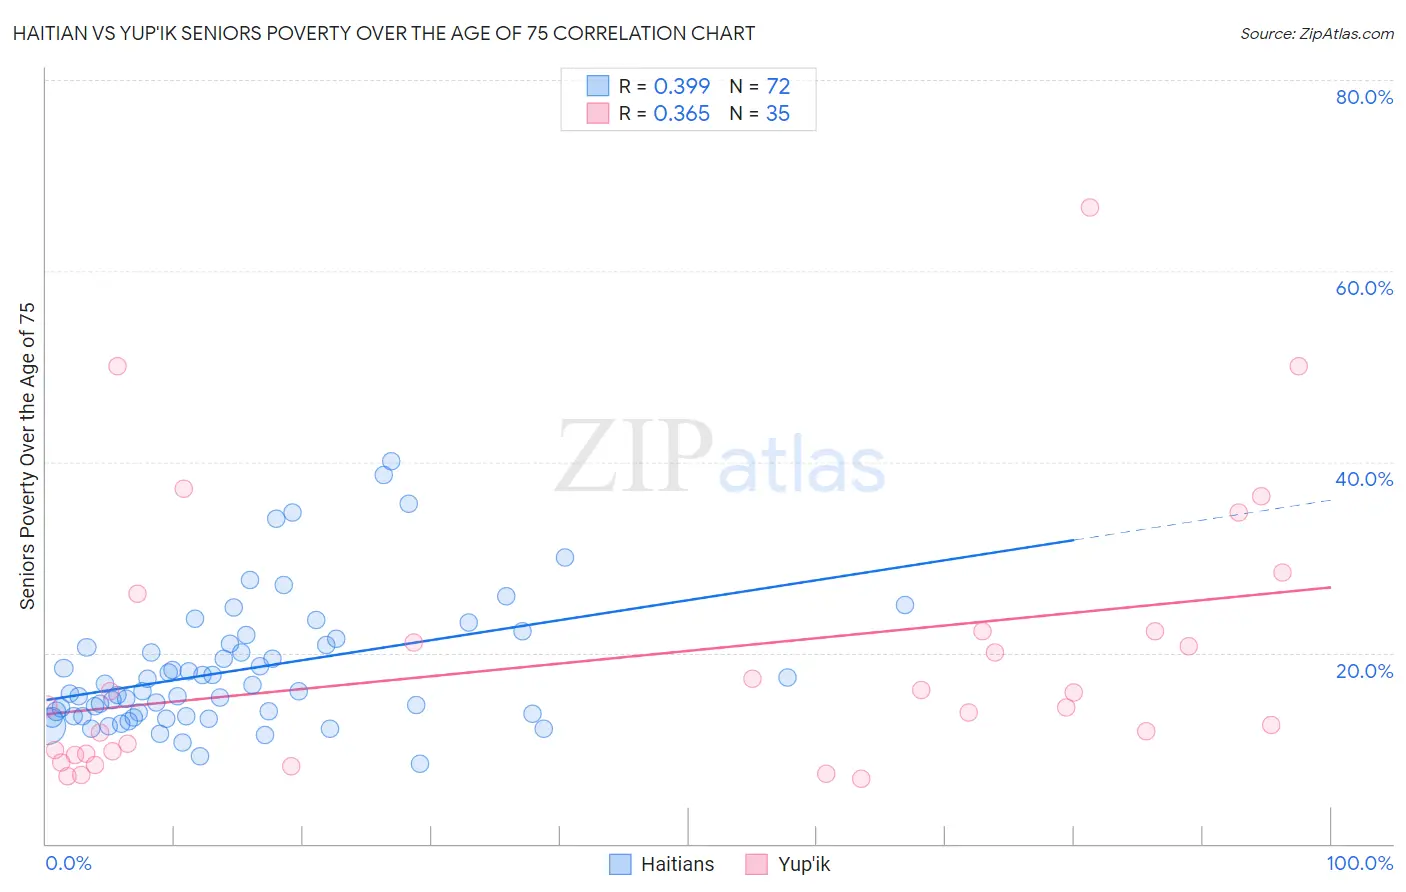
Haitian vs Yup'ik Seniors Poverty Over the Age of 75 Correlation Chart
The statistical analysis conducted on geographies consisting of 285,241,785 people shows a mild positive correlation between the proportion of Haitians and poverty level among seniors over the age of 75 in the United States with a correlation coefficient (R) of 0.399 and weighted average of 16.2%. Similarly, the statistical analysis conducted on geographies consisting of 39,739,861 people shows a mild positive correlation between the proportion of Yup'ik and poverty level among seniors over the age of 75 in the United States with a correlation coefficient (R) of 0.365 and weighted average of 15.8%, a difference of 2.5%.
Seniors Poverty Over the Age of 75 Correlation Summary
| Measurement | Haitian | Yup'ik |
| Minimum | 8.4% | 6.8% |
| Maximum | 40.1% | 66.7% |
| Range | 31.7% | 59.9% |
| Mean | 18.2% | 19.5% |
| Median | 16.0% | 14.4% |
| Interquartile 25% (IQ1) | 13.4% | 9.4% |
| Interquartile 75% (IQ3) | 20.9% | 22.2% |
| Interquartile Range (IQR) | 7.5% | 12.8% |
| Standard Deviation (Sample) | 6.8% | 14.2% |
| Standard Deviation (Population) | 6.8% | 14.0% |
Demographics Similar to Haitians and Yup'ik by Seniors Poverty Over the Age of 75
In terms of seniors poverty over the age of 75, the demographic groups most similar to Haitians are Houma (16.2%, a difference of 0.040%), Immigrants from Guyana (16.2%, a difference of 0.17%), Immigrants from Ecuador (16.1%, a difference of 0.78%), Guyanese (16.1%, a difference of 0.79%), and Tsimshian (16.1%, a difference of 1.1%). Similarly, the demographic groups most similar to Yup'ik are Vietnamese (15.9%, a difference of 0.10%), Trinidadian and Tobagonian (15.9%, a difference of 0.20%), Immigrants from Bangladesh (15.8%, a difference of 0.30%), Immigrants from West Indies (15.8%, a difference of 0.34%), and Hispanic or Latino (15.8%, a difference of 0.48%).
| Demographics | Rating | Rank | Seniors Poverty Over the Age of 75 |
| Immigrants | Trinidad and Tobago | 0.0 /100 | #304 | Tragic 15.7% |
| Ecuadorians | 0.0 /100 | #305 | Tragic 15.7% |
| Hispanics or Latinos | 0.0 /100 | #306 | Tragic 15.8% |
| Immigrants | West Indies | 0.0 /100 | #307 | Tragic 15.8% |
| Immigrants | Bangladesh | 0.0 /100 | #308 | Tragic 15.8% |
| Yup'ik | 0.0 /100 | #309 | Tragic 15.8% |
| Vietnamese | 0.0 /100 | #310 | Tragic 15.9% |
| Trinidadians and Tobagonians | 0.0 /100 | #311 | Tragic 15.9% |
| Crow | 0.0 /100 | #312 | Tragic 15.9% |
| Barbadians | 0.0 /100 | #313 | Tragic 16.0% |
| Tsimshian | 0.0 /100 | #314 | Tragic 16.1% |
| Guyanese | 0.0 /100 | #315 | Tragic 16.1% |
| Immigrants | Ecuador | 0.0 /100 | #316 | Tragic 16.1% |
| Immigrants | Guyana | 0.0 /100 | #317 | Tragic 16.2% |
| Houma | 0.0 /100 | #318 | Tragic 16.2% |
| Haitians | 0.0 /100 | #319 | Tragic 16.2% |
| Immigrants | Yemen | 0.0 /100 | #320 | Tragic 16.5% |
| Immigrants | Haiti | 0.0 /100 | #321 | Tragic 16.5% |
| Immigrants | Barbados | 0.0 /100 | #322 | Tragic 16.5% |
| Central American Indians | 0.0 /100 | #323 | Tragic 16.5% |
| Immigrants | Uzbekistan | 0.0 /100 | #324 | Tragic 16.5% |