Immigrants from Dominica vs Yup'ik Seniors Poverty Over the Age of 75
COMPARE
Immigrants from Dominica
Yup'ik
Seniors Poverty Over the Age of 75
Seniors Poverty Over the Age of 75 Comparison
Immigrants from Dominica
Yup'ik
17.0%
SENIORS POVERTY OVER THE AGE OF 75
0.0/ 100
METRIC RATING
329th/ 347
METRIC RANK
15.8%
SENIORS POVERTY OVER THE AGE OF 75
0.0/ 100
METRIC RATING
309th/ 347
METRIC RANK
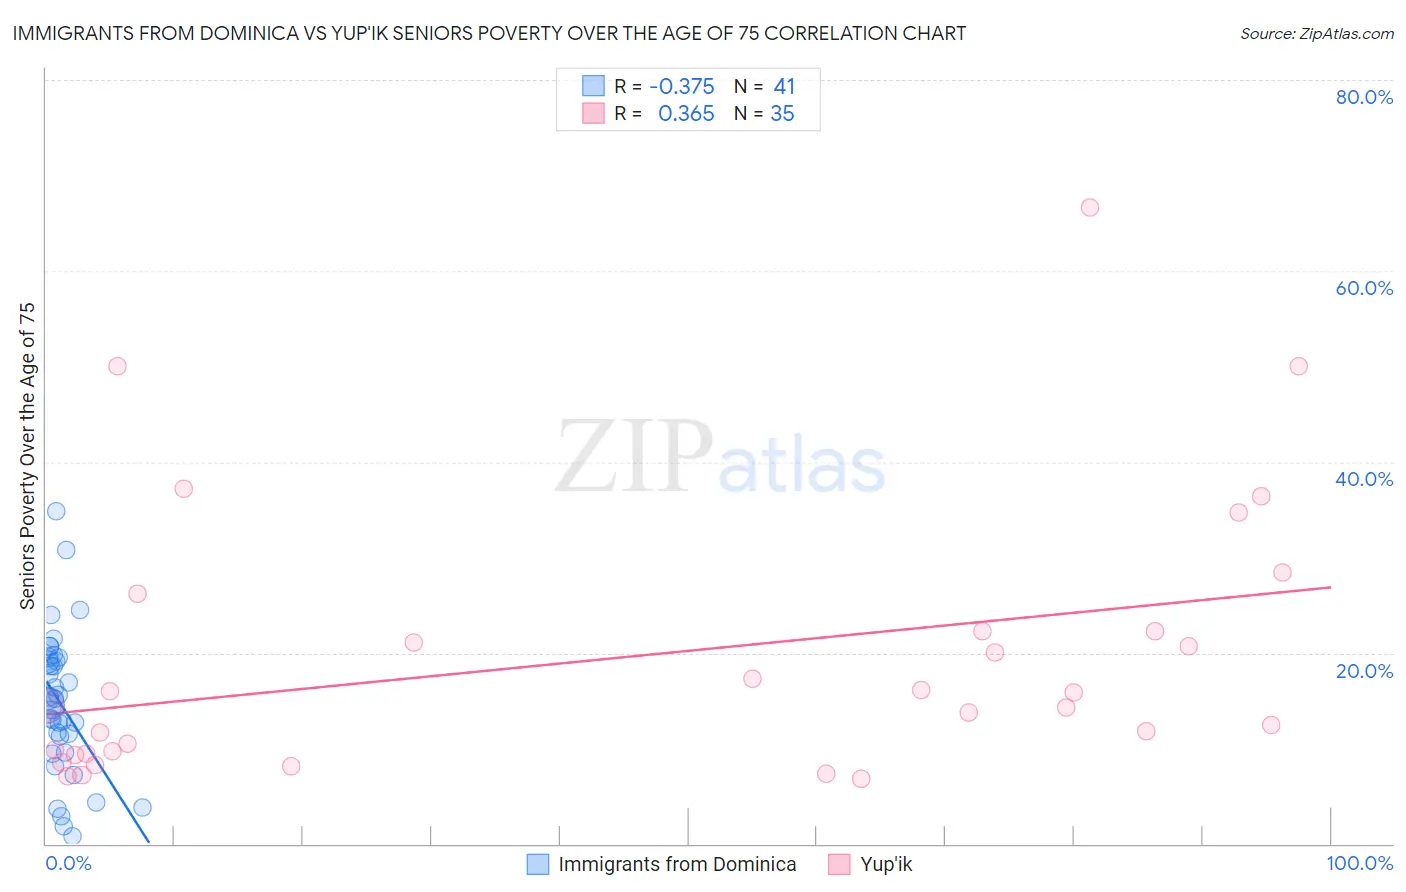
Immigrants from Dominica vs Yup'ik Seniors Poverty Over the Age of 75 Correlation Chart
The statistical analysis conducted on geographies consisting of 83,495,108 people shows a mild negative correlation between the proportion of Immigrants from Dominica and poverty level among seniors over the age of 75 in the United States with a correlation coefficient (R) of -0.375 and weighted average of 17.0%. Similarly, the statistical analysis conducted on geographies consisting of 39,739,861 people shows a mild positive correlation between the proportion of Yup'ik and poverty level among seniors over the age of 75 in the United States with a correlation coefficient (R) of 0.365 and weighted average of 15.8%, a difference of 7.3%.
Seniors Poverty Over the Age of 75 Correlation Summary
| Measurement | Immigrants from Dominica | Yup'ik |
| Minimum | 0.80% | 6.8% |
| Maximum | 34.8% | 66.7% |
| Range | 34.0% | 59.9% |
| Mean | 14.7% | 19.5% |
| Median | 15.1% | 14.4% |
| Interquartile 25% (IQ1) | 10.4% | 9.4% |
| Interquartile 75% (IQ3) | 19.3% | 22.2% |
| Interquartile Range (IQR) | 8.9% | 12.8% |
| Standard Deviation (Sample) | 7.4% | 14.2% |
| Standard Deviation (Population) | 7.3% | 14.0% |
Demographics Similar to Immigrants from Dominica and Yup'ik by Seniors Poverty Over the Age of 75
In terms of seniors poverty over the age of 75, the demographic groups most similar to Immigrants from Dominica are Cape Verdean (16.8%, a difference of 1.4%), Sioux (16.8%, a difference of 1.4%), Pueblo (16.7%, a difference of 1.7%), Nicaraguan (16.6%, a difference of 2.4%), and Immigrants from Uzbekistan (16.5%, a difference of 2.8%). Similarly, the demographic groups most similar to Yup'ik are Vietnamese (15.9%, a difference of 0.10%), Trinidadian and Tobagonian (15.9%, a difference of 0.20%), Crow (15.9%, a difference of 0.61%), Barbadian (16.0%, a difference of 1.1%), and Tsimshian (16.1%, a difference of 1.4%).
| Demographics | Rating | Rank | Seniors Poverty Over the Age of 75 |
| Yup'ik | 0.0 /100 | #309 | Tragic 15.8% |
| Vietnamese | 0.0 /100 | #310 | Tragic 15.9% |
| Trinidadians and Tobagonians | 0.0 /100 | #311 | Tragic 15.9% |
| Crow | 0.0 /100 | #312 | Tragic 15.9% |
| Barbadians | 0.0 /100 | #313 | Tragic 16.0% |
| Tsimshian | 0.0 /100 | #314 | Tragic 16.1% |
| Guyanese | 0.0 /100 | #315 | Tragic 16.1% |
| Immigrants | Ecuador | 0.0 /100 | #316 | Tragic 16.1% |
| Immigrants | Guyana | 0.0 /100 | #317 | Tragic 16.2% |
| Houma | 0.0 /100 | #318 | Tragic 16.2% |
| Haitians | 0.0 /100 | #319 | Tragic 16.2% |
| Immigrants | Yemen | 0.0 /100 | #320 | Tragic 16.5% |
| Immigrants | Haiti | 0.0 /100 | #321 | Tragic 16.5% |
| Immigrants | Barbados | 0.0 /100 | #322 | Tragic 16.5% |
| Central American Indians | 0.0 /100 | #323 | Tragic 16.5% |
| Immigrants | Uzbekistan | 0.0 /100 | #324 | Tragic 16.5% |
| Nicaraguans | 0.0 /100 | #325 | Tragic 16.6% |
| Pueblo | 0.0 /100 | #326 | Tragic 16.7% |
| Sioux | 0.0 /100 | #327 | Tragic 16.8% |
| Cape Verdeans | 0.0 /100 | #328 | Tragic 16.8% |
| Immigrants | Dominica | 0.0 /100 | #329 | Tragic 17.0% |