Immigrants from Kenya vs Zimbabwean Seniors Poverty Over the Age of 75
COMPARE
Immigrants from Kenya
Zimbabwean
Seniors Poverty Over the Age of 75
Seniors Poverty Over the Age of 75 Comparison
Immigrants from Kenya
Zimbabweans
11.9%
SENIORS POVERTY OVER THE AGE OF 75
72.6/ 100
METRIC RATING
139th/ 347
METRIC RANK
11.2%
SENIORS POVERTY OVER THE AGE OF 75
98.5/ 100
METRIC RATING
52nd/ 347
METRIC RANK
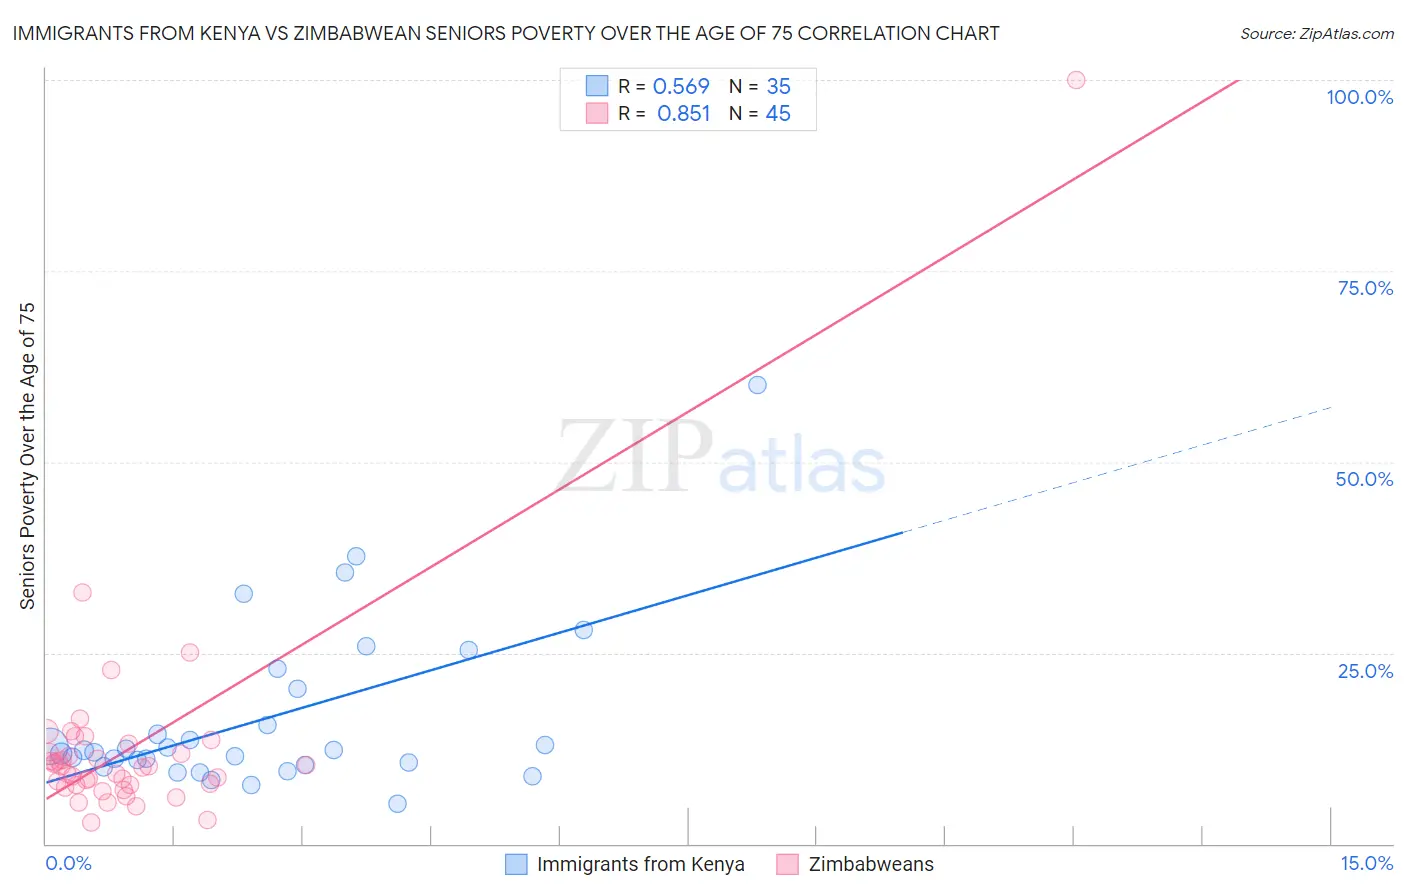
Immigrants from Kenya vs Zimbabwean Seniors Poverty Over the Age of 75 Correlation Chart
The statistical analysis conducted on geographies consisting of 216,694,487 people shows a substantial positive correlation between the proportion of Immigrants from Kenya and poverty level among seniors over the age of 75 in the United States with a correlation coefficient (R) of 0.569 and weighted average of 11.9%. Similarly, the statistical analysis conducted on geographies consisting of 68,929,819 people shows a very strong positive correlation between the proportion of Zimbabweans and poverty level among seniors over the age of 75 in the United States with a correlation coefficient (R) of 0.851 and weighted average of 11.2%, a difference of 7.1%.
Seniors Poverty Over the Age of 75 Correlation Summary
| Measurement | Immigrants from Kenya | Zimbabwean |
| Minimum | 5.3% | 2.7% |
| Maximum | 60.0% | 100.0% |
| Range | 54.7% | 97.3% |
| Mean | 16.5% | 12.7% |
| Median | 12.2% | 10.2% |
| Interquartile 25% (IQ1) | 10.2% | 7.6% |
| Interquartile 75% (IQ3) | 20.3% | 12.5% |
| Interquartile Range (IQR) | 10.1% | 4.9% |
| Standard Deviation (Sample) | 11.1% | 14.4% |
| Standard Deviation (Population) | 11.0% | 14.2% |
Similar Demographics by Seniors Poverty Over the Age of 75
Demographics Similar to Immigrants from Kenya by Seniors Poverty Over the Age of 75
In terms of seniors poverty over the age of 75, the demographic groups most similar to Immigrants from Kenya are Immigrants from Romania (11.9%, a difference of 0.010%), Immigrants from Pakistan (12.0%, a difference of 0.070%), Immigrants from Cameroon (12.0%, a difference of 0.080%), Immigrants from Laos (12.0%, a difference of 0.11%), and American (12.0%, a difference of 0.16%).
| Demographics | Rating | Rank | Seniors Poverty Over the Age of 75 |
| Lebanese | 78.3 /100 | #132 | Good 11.9% |
| Immigrants | Sierra Leone | 77.6 /100 | #133 | Good 11.9% |
| Ugandans | 77.1 /100 | #134 | Good 11.9% |
| Immigrants | Ireland | 76.2 /100 | #135 | Good 11.9% |
| Immigrants | Philippines | 75.0 /100 | #136 | Good 11.9% |
| Immigrants | Moldova | 74.1 /100 | #137 | Good 11.9% |
| Immigrants | Romania | 72.6 /100 | #138 | Good 11.9% |
| Immigrants | Kenya | 72.6 /100 | #139 | Good 11.9% |
| Immigrants | Pakistan | 71.9 /100 | #140 | Good 12.0% |
| Immigrants | Cameroon | 71.7 /100 | #141 | Good 12.0% |
| Immigrants | Laos | 71.5 /100 | #142 | Good 12.0% |
| Americans | 71.0 /100 | #143 | Good 12.0% |
| Hmong | 70.8 /100 | #144 | Good 12.0% |
| Immigrants | Belgium | 70.8 /100 | #145 | Good 12.0% |
| Bangladeshis | 70.4 /100 | #146 | Good 12.0% |
Demographics Similar to Zimbabweans by Seniors Poverty Over the Age of 75
In terms of seniors poverty over the age of 75, the demographic groups most similar to Zimbabweans are Immigrants from England (11.2%, a difference of 0.070%), Immigrants from North Macedonia (11.1%, a difference of 0.16%), Serbian (11.1%, a difference of 0.18%), Samoan (11.1%, a difference of 0.29%), and Afghan (11.2%, a difference of 0.38%).
| Demographics | Rating | Rank | Seniors Poverty Over the Age of 75 |
| Carpatho Rusyns | 99.0 /100 | #45 | Exceptional 11.1% |
| Greeks | 99.0 /100 | #46 | Exceptional 11.1% |
| Hawaiians | 98.8 /100 | #47 | Exceptional 11.1% |
| French | 98.7 /100 | #48 | Exceptional 11.1% |
| Samoans | 98.7 /100 | #49 | Exceptional 11.1% |
| Serbians | 98.6 /100 | #50 | Exceptional 11.1% |
| Immigrants | North Macedonia | 98.6 /100 | #51 | Exceptional 11.1% |
| Zimbabweans | 98.5 /100 | #52 | Exceptional 11.2% |
| Immigrants | England | 98.4 /100 | #53 | Exceptional 11.2% |
| Afghans | 98.2 /100 | #54 | Exceptional 11.2% |
| Hungarians | 98.1 /100 | #55 | Exceptional 11.2% |
| Slavs | 98.1 /100 | #56 | Exceptional 11.2% |
| Immigrants | Canada | 97.9 /100 | #57 | Exceptional 11.2% |
| Yugoslavians | 97.9 /100 | #58 | Exceptional 11.2% |
| Immigrants | Netherlands | 97.8 /100 | #59 | Exceptional 11.2% |