Immigrants from Kenya vs Greek Child Poverty Under the Age of 16
COMPARE
Immigrants from Kenya
Greek
Child Poverty Under the Age of 16
Child Poverty Under the Age of 16 Comparison
Immigrants from Kenya
Greeks
16.9%
CHILD POVERTY UNDER THE AGE OF 16
19.1/ 100
METRIC RATING
197th/ 347
METRIC RANK
13.8%
CHILD POVERTY UNDER THE AGE OF 16
99.3/ 100
METRIC RATING
44th/ 347
METRIC RANK
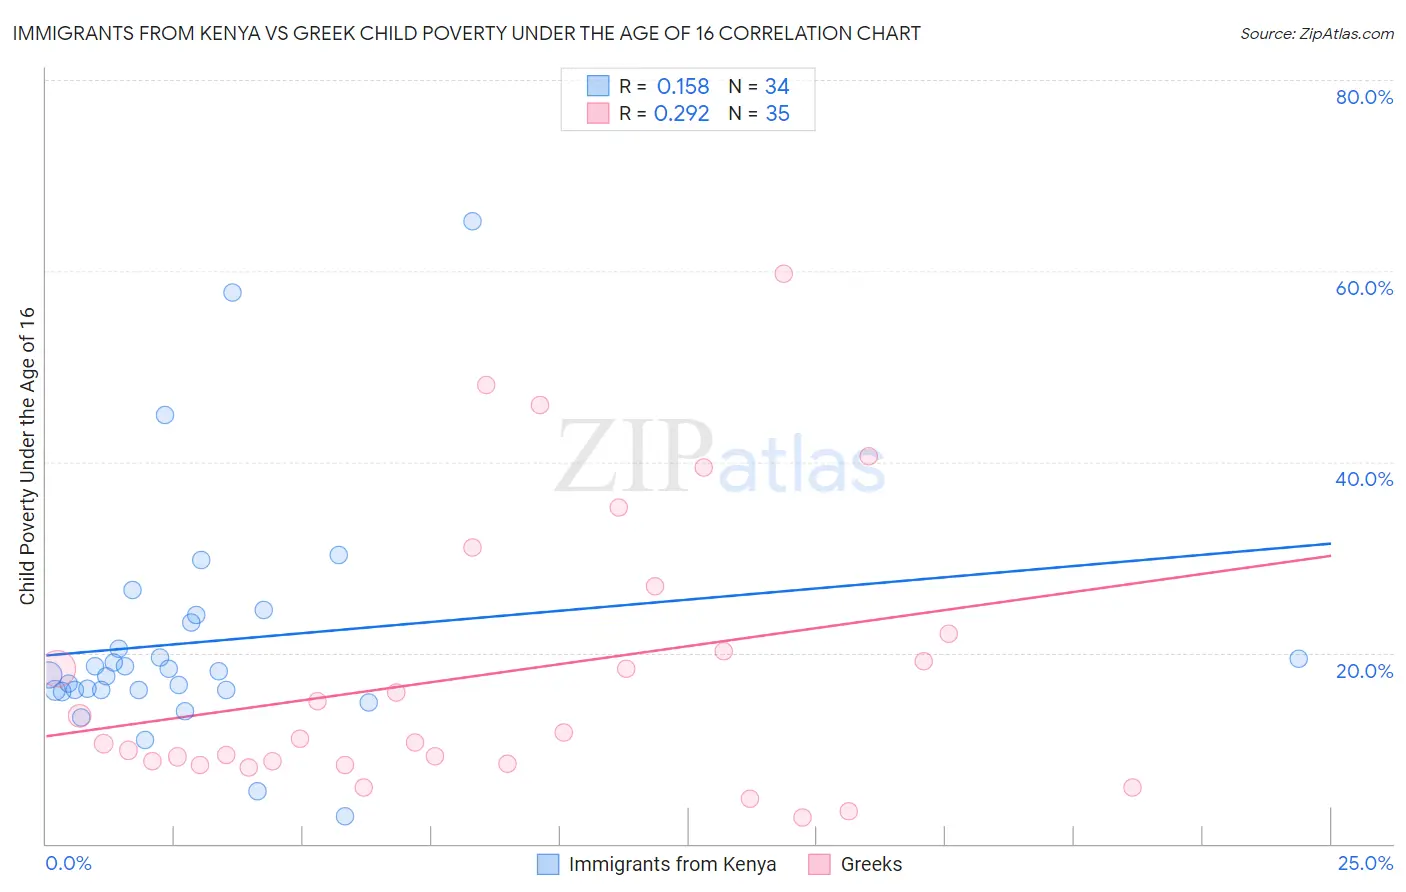
Immigrants from Kenya vs Greek Child Poverty Under the Age of 16 Correlation Chart
The statistical analysis conducted on geographies consisting of 217,344,865 people shows a poor positive correlation between the proportion of Immigrants from Kenya and poverty level among children under the age of 16 in the United States with a correlation coefficient (R) of 0.158 and weighted average of 16.9%. Similarly, the statistical analysis conducted on geographies consisting of 475,284,984 people shows a weak positive correlation between the proportion of Greeks and poverty level among children under the age of 16 in the United States with a correlation coefficient (R) of 0.292 and weighted average of 13.8%, a difference of 22.5%.
Child Poverty Under the Age of 16 Correlation Summary
| Measurement | Immigrants from Kenya | Greek |
| Minimum | 2.8% | 2.8% |
| Maximum | 65.2% | 59.6% |
| Range | 62.4% | 56.9% |
| Mean | 21.2% | 17.8% |
| Median | 17.9% | 11.0% |
| Interquartile 25% (IQ1) | 16.1% | 8.3% |
| Interquartile 75% (IQ3) | 23.1% | 22.0% |
| Interquartile Range (IQR) | 7.1% | 13.6% |
| Standard Deviation (Sample) | 12.5% | 14.3% |
| Standard Deviation (Population) | 12.3% | 14.1% |
Similar Demographics by Child Poverty Under the Age of 16
Demographics Similar to Immigrants from Kenya by Child Poverty Under the Age of 16
In terms of child poverty under the age of 16, the demographic groups most similar to Immigrants from Kenya are Delaware (17.0%, a difference of 0.40%), Immigrants from Lebanon (16.8%, a difference of 0.52%), Immigrants from Uganda (16.8%, a difference of 0.60%), Immigrants from Uruguay (16.8%, a difference of 0.69%), and Spaniard (16.8%, a difference of 0.71%).
| Demographics | Rating | Rank | Child Poverty Under the Age of 16 |
| Immigrants | Costa Rica | 29.6 /100 | #190 | Fair 16.6% |
| Immigrants | Iraq | 28.3 /100 | #191 | Fair 16.7% |
| Spanish | 24.5 /100 | #192 | Fair 16.7% |
| Spaniards | 23.2 /100 | #193 | Fair 16.8% |
| Immigrants | Uruguay | 23.1 /100 | #194 | Fair 16.8% |
| Immigrants | Uganda | 22.5 /100 | #195 | Fair 16.8% |
| Immigrants | Lebanon | 22.0 /100 | #196 | Fair 16.8% |
| Immigrants | Kenya | 19.1 /100 | #197 | Poor 16.9% |
| Delaware | 17.1 /100 | #198 | Poor 17.0% |
| Immigrants | Afghanistan | 15.1 /100 | #199 | Poor 17.0% |
| Immigrants | Cameroon | 14.7 /100 | #200 | Poor 17.1% |
| Immigrants | Uzbekistan | 14.7 /100 | #201 | Poor 17.1% |
| Ugandans | 14.3 /100 | #202 | Poor 17.1% |
| Immigrants | Sierra Leone | 14.2 /100 | #203 | Poor 17.1% |
| Hmong | 14.0 /100 | #204 | Poor 17.1% |
Demographics Similar to Greeks by Child Poverty Under the Age of 16
In terms of child poverty under the age of 16, the demographic groups most similar to Greeks are Czech (13.8%, a difference of 0.050%), Immigrants from Moldova (13.8%, a difference of 0.17%), Immigrants from Sri Lanka (13.8%, a difference of 0.23%), Croatian (13.8%, a difference of 0.31%), and Immigrants from Asia (13.8%, a difference of 0.34%).
| Demographics | Rating | Rank | Child Poverty Under the Age of 16 |
| Immigrants | Bolivia | 99.6 /100 | #37 | Exceptional 13.6% |
| Luxembourgers | 99.5 /100 | #38 | Exceptional 13.6% |
| Immigrants | Australia | 99.5 /100 | #39 | Exceptional 13.6% |
| Immigrants | Scotland | 99.4 /100 | #40 | Exceptional 13.7% |
| Croatians | 99.4 /100 | #41 | Exceptional 13.8% |
| Immigrants | Sri Lanka | 99.3 /100 | #42 | Exceptional 13.8% |
| Immigrants | Moldova | 99.3 /100 | #43 | Exceptional 13.8% |
| Greeks | 99.3 /100 | #44 | Exceptional 13.8% |
| Czechs | 99.3 /100 | #45 | Exceptional 13.8% |
| Immigrants | Asia | 99.2 /100 | #46 | Exceptional 13.8% |
| Estonians | 99.2 /100 | #47 | Exceptional 13.9% |
| Koreans | 99.2 /100 | #48 | Exceptional 13.9% |
| Italians | 99.2 /100 | #49 | Exceptional 13.9% |
| Immigrants | Czechoslovakia | 99.1 /100 | #50 | Exceptional 13.9% |
| Immigrants | Greece | 99.1 /100 | #51 | Exceptional 13.9% |