Immigrants from Kenya vs Guyanese Child Poverty Under the Age of 16
COMPARE
Immigrants from Kenya
Guyanese
Child Poverty Under the Age of 16
Child Poverty Under the Age of 16 Comparison
Immigrants from Kenya
Guyanese
16.9%
CHILD POVERTY UNDER THE AGE OF 16
19.1/ 100
METRIC RATING
197th/ 347
METRIC RANK
19.3%
CHILD POVERTY UNDER THE AGE OF 16
0.2/ 100
METRIC RATING
260th/ 347
METRIC RANK
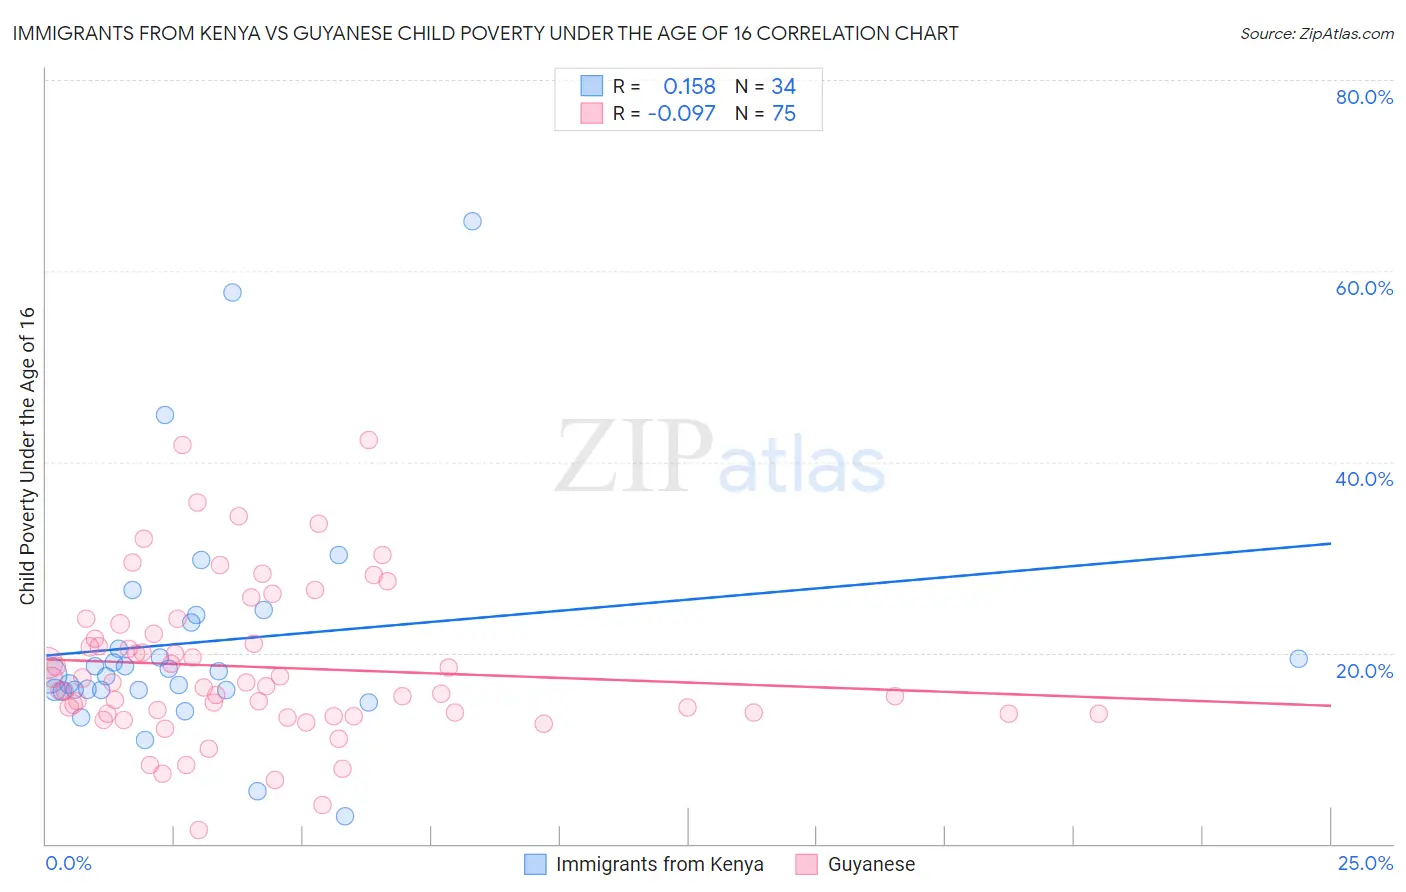
Immigrants from Kenya vs Guyanese Child Poverty Under the Age of 16 Correlation Chart
The statistical analysis conducted on geographies consisting of 217,344,865 people shows a poor positive correlation between the proportion of Immigrants from Kenya and poverty level among children under the age of 16 in the United States with a correlation coefficient (R) of 0.158 and weighted average of 16.9%. Similarly, the statistical analysis conducted on geographies consisting of 176,124,760 people shows a slight negative correlation between the proportion of Guyanese and poverty level among children under the age of 16 in the United States with a correlation coefficient (R) of -0.097 and weighted average of 19.3%, a difference of 14.5%.
Child Poverty Under the Age of 16 Correlation Summary
| Measurement | Immigrants from Kenya | Guyanese |
| Minimum | 2.8% | 1.5% |
| Maximum | 65.2% | 42.3% |
| Range | 62.4% | 40.8% |
| Mean | 21.2% | 18.5% |
| Median | 17.9% | 16.5% |
| Interquartile 25% (IQ1) | 16.1% | 13.6% |
| Interquartile 75% (IQ3) | 23.1% | 22.0% |
| Interquartile Range (IQR) | 7.1% | 8.3% |
| Standard Deviation (Sample) | 12.5% | 8.0% |
| Standard Deviation (Population) | 12.3% | 8.0% |
Similar Demographics by Child Poverty Under the Age of 16
Demographics Similar to Immigrants from Kenya by Child Poverty Under the Age of 16
In terms of child poverty under the age of 16, the demographic groups most similar to Immigrants from Kenya are Delaware (17.0%, a difference of 0.40%), Immigrants from Lebanon (16.8%, a difference of 0.52%), Immigrants from Uganda (16.8%, a difference of 0.60%), Immigrants from Uruguay (16.8%, a difference of 0.69%), and Spaniard (16.8%, a difference of 0.71%).
| Demographics | Rating | Rank | Child Poverty Under the Age of 16 |
| Immigrants | Costa Rica | 29.6 /100 | #190 | Fair 16.6% |
| Immigrants | Iraq | 28.3 /100 | #191 | Fair 16.7% |
| Spanish | 24.5 /100 | #192 | Fair 16.7% |
| Spaniards | 23.2 /100 | #193 | Fair 16.8% |
| Immigrants | Uruguay | 23.1 /100 | #194 | Fair 16.8% |
| Immigrants | Uganda | 22.5 /100 | #195 | Fair 16.8% |
| Immigrants | Lebanon | 22.0 /100 | #196 | Fair 16.8% |
| Immigrants | Kenya | 19.1 /100 | #197 | Poor 16.9% |
| Delaware | 17.1 /100 | #198 | Poor 17.0% |
| Immigrants | Afghanistan | 15.1 /100 | #199 | Poor 17.0% |
| Immigrants | Cameroon | 14.7 /100 | #200 | Poor 17.1% |
| Immigrants | Uzbekistan | 14.7 /100 | #201 | Poor 17.1% |
| Ugandans | 14.3 /100 | #202 | Poor 17.1% |
| Immigrants | Sierra Leone | 14.2 /100 | #203 | Poor 17.1% |
| Hmong | 14.0 /100 | #204 | Poor 17.1% |
Demographics Similar to Guyanese by Child Poverty Under the Age of 16
In terms of child poverty under the age of 16, the demographic groups most similar to Guyanese are Immigrants from Burma/Myanmar (19.4%, a difference of 0.080%), Mexican American Indian (19.3%, a difference of 0.10%), Immigrants from Guyana (19.4%, a difference of 0.12%), Vietnamese (19.4%, a difference of 0.44%), and Immigrants from Ecuador (19.4%, a difference of 0.50%).
| Demographics | Rating | Rank | Child Poverty Under the Age of 16 |
| Salvadorans | 0.3 /100 | #253 | Tragic 19.1% |
| Immigrants | Western Africa | 0.2 /100 | #254 | Tragic 19.2% |
| Trinidadians and Tobagonians | 0.2 /100 | #255 | Tragic 19.2% |
| Inupiat | 0.2 /100 | #256 | Tragic 19.2% |
| Ottawa | 0.2 /100 | #257 | Tragic 19.2% |
| Spanish Americans | 0.2 /100 | #258 | Tragic 19.2% |
| Mexican American Indians | 0.2 /100 | #259 | Tragic 19.3% |
| Guyanese | 0.2 /100 | #260 | Tragic 19.3% |
| Immigrants | Burma/Myanmar | 0.1 /100 | #261 | Tragic 19.4% |
| Immigrants | Guyana | 0.1 /100 | #262 | Tragic 19.4% |
| Vietnamese | 0.1 /100 | #263 | Tragic 19.4% |
| Immigrants | Ecuador | 0.1 /100 | #264 | Tragic 19.4% |
| Chickasaw | 0.1 /100 | #265 | Tragic 19.5% |
| Liberians | 0.1 /100 | #266 | Tragic 19.5% |
| Cherokee | 0.1 /100 | #267 | Tragic 19.5% |