Assyrian/Chaldean/Syriac vs Greek Child Poverty Under the Age of 16
COMPARE
Assyrian/Chaldean/Syriac
Greek
Child Poverty Under the Age of 16
Child Poverty Under the Age of 16 Comparison
Assyrians/Chaldeans/Syriacs
Greeks
13.3%
CHILD POVERTY UNDER THE AGE OF 16
99.7/ 100
METRIC RATING
28th/ 347
METRIC RANK
13.8%
CHILD POVERTY UNDER THE AGE OF 16
99.3/ 100
METRIC RATING
44th/ 347
METRIC RANK
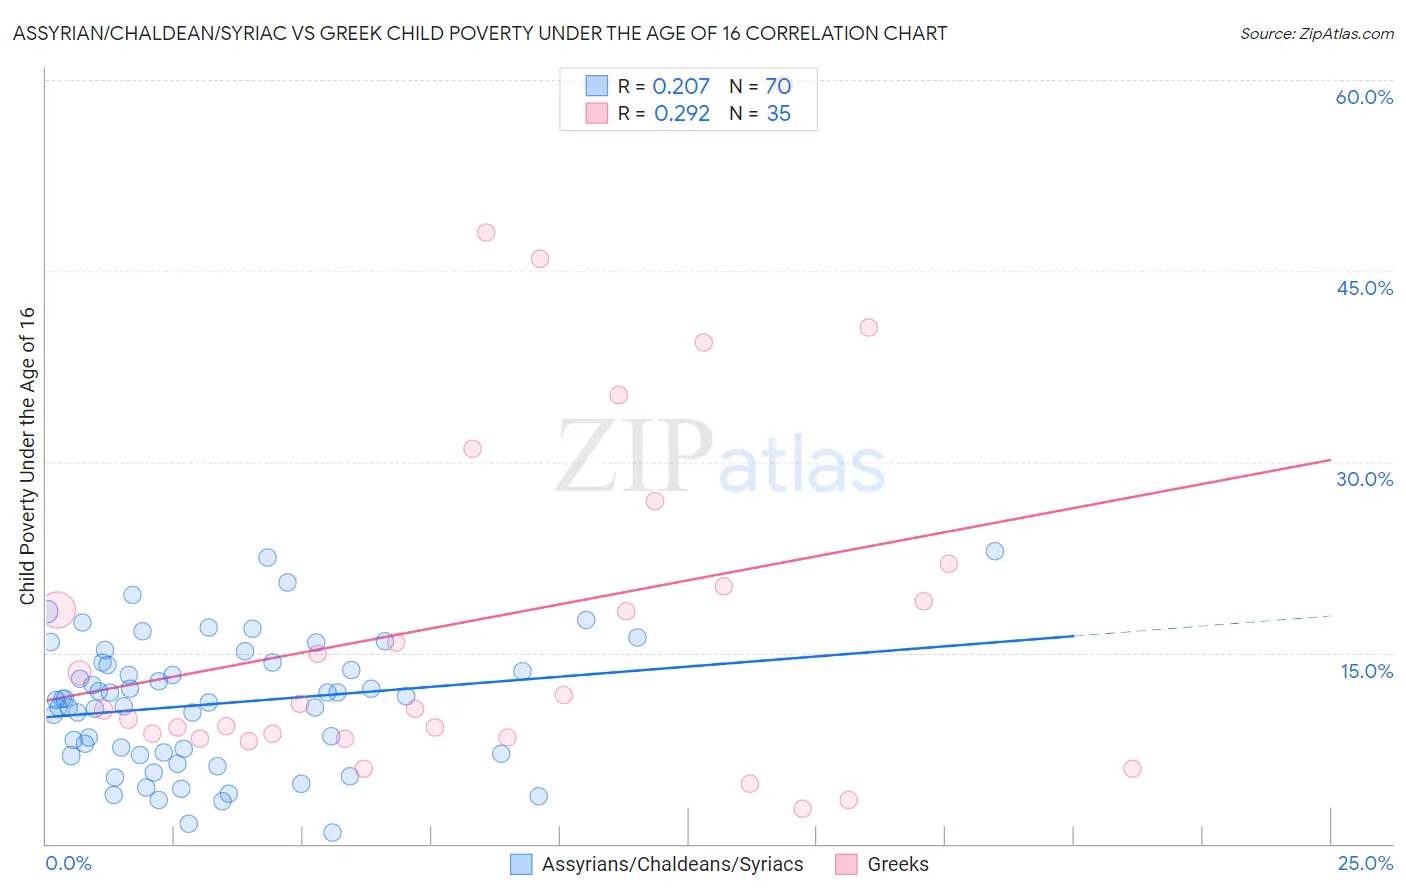
Assyrian/Chaldean/Syriac vs Greek Child Poverty Under the Age of 16 Correlation Chart
The statistical analysis conducted on geographies consisting of 109,836,821 people shows a weak positive correlation between the proportion of Assyrians/Chaldeans/Syriacs and poverty level among children under the age of 16 in the United States with a correlation coefficient (R) of 0.207 and weighted average of 13.3%. Similarly, the statistical analysis conducted on geographies consisting of 475,284,984 people shows a weak positive correlation between the proportion of Greeks and poverty level among children under the age of 16 in the United States with a correlation coefficient (R) of 0.292 and weighted average of 13.8%, a difference of 3.7%.
Child Poverty Under the Age of 16 Correlation Summary
| Measurement | Assyrian/Chaldean/Syriac | Greek |
| Minimum | 0.91% | 2.8% |
| Maximum | 23.0% | 59.6% |
| Range | 22.1% | 56.9% |
| Mean | 11.0% | 17.8% |
| Median | 11.3% | 11.0% |
| Interquartile 25% (IQ1) | 7.0% | 8.3% |
| Interquartile 75% (IQ3) | 14.2% | 22.0% |
| Interquartile Range (IQR) | 7.2% | 13.6% |
| Standard Deviation (Sample) | 5.0% | 14.3% |
| Standard Deviation (Population) | 5.0% | 14.1% |
Demographics Similar to Assyrians/Chaldeans/Syriacs and Greeks by Child Poverty Under the Age of 16
In terms of child poverty under the age of 16, the demographic groups most similar to Assyrians/Chaldeans/Syriacs are Swedish (13.3%, a difference of 0.18%), Immigrants from China (13.3%, a difference of 0.24%), Turkish (13.4%, a difference of 0.48%), Bolivian (13.2%, a difference of 0.53%), and Danish (13.4%, a difference of 0.68%). Similarly, the demographic groups most similar to Greeks are Czech (13.8%, a difference of 0.050%), Immigrants from Moldova (13.8%, a difference of 0.17%), Immigrants from Sri Lanka (13.8%, a difference of 0.23%), Croatian (13.8%, a difference of 0.31%), and Immigrants from Asia (13.8%, a difference of 0.34%).
| Demographics | Rating | Rank | Child Poverty Under the Age of 16 |
| Bolivians | 99.8 /100 | #26 | Exceptional 13.2% |
| Immigrants | China | 99.8 /100 | #27 | Exceptional 13.3% |
| Assyrians/Chaldeans/Syriacs | 99.7 /100 | #28 | Exceptional 13.3% |
| Swedes | 99.7 /100 | #29 | Exceptional 13.3% |
| Turks | 99.7 /100 | #30 | Exceptional 13.4% |
| Danes | 99.7 /100 | #31 | Exceptional 13.4% |
| Tongans | 99.7 /100 | #32 | Exceptional 13.4% |
| Asians | 99.6 /100 | #33 | Exceptional 13.5% |
| Russians | 99.6 /100 | #34 | Exceptional 13.5% |
| Lithuanians | 99.6 /100 | #35 | Exceptional 13.5% |
| Immigrants | Northern Europe | 99.6 /100 | #36 | Exceptional 13.6% |
| Immigrants | Bolivia | 99.6 /100 | #37 | Exceptional 13.6% |
| Luxembourgers | 99.5 /100 | #38 | Exceptional 13.6% |
| Immigrants | Australia | 99.5 /100 | #39 | Exceptional 13.6% |
| Immigrants | Scotland | 99.4 /100 | #40 | Exceptional 13.7% |
| Croatians | 99.4 /100 | #41 | Exceptional 13.8% |
| Immigrants | Sri Lanka | 99.3 /100 | #42 | Exceptional 13.8% |
| Immigrants | Moldova | 99.3 /100 | #43 | Exceptional 13.8% |
| Greeks | 99.3 /100 | #44 | Exceptional 13.8% |
| Czechs | 99.3 /100 | #45 | Exceptional 13.8% |
| Immigrants | Asia | 99.2 /100 | #46 | Exceptional 13.8% |