Immigrants from Kazakhstan vs Immigrants from Hong Kong Poverty
COMPARE
Immigrants from Kazakhstan
Immigrants from Hong Kong
Poverty
Poverty Comparison
Immigrants from Kazakhstan
Immigrants from Hong Kong
12.0%
POVERTY
72.3/ 100
METRIC RATING
150th/ 347
METRIC RANK
10.4%
POVERTY
99.8/ 100
METRIC RATING
13th/ 347
METRIC RANK
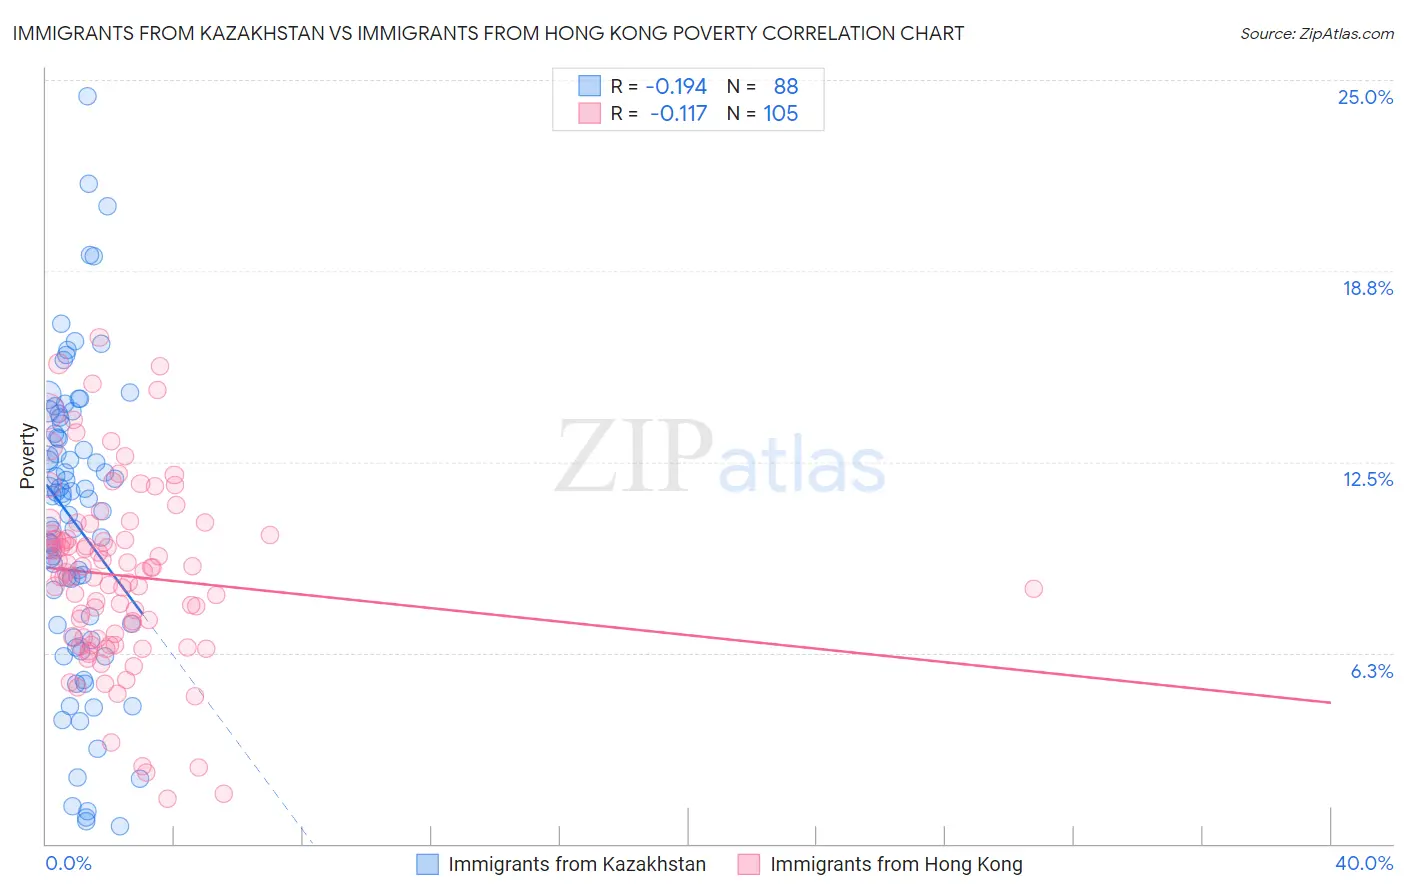
Immigrants from Kazakhstan vs Immigrants from Hong Kong Poverty Correlation Chart
The statistical analysis conducted on geographies consisting of 124,425,744 people shows a poor negative correlation between the proportion of Immigrants from Kazakhstan and poverty level in the United States with a correlation coefficient (R) of -0.194 and weighted average of 12.0%. Similarly, the statistical analysis conducted on geographies consisting of 253,892,762 people shows a poor negative correlation between the proportion of Immigrants from Hong Kong and poverty level in the United States with a correlation coefficient (R) of -0.117 and weighted average of 10.4%, a difference of 15.6%.
Poverty Correlation Summary
| Measurement | Immigrants from Kazakhstan | Immigrants from Hong Kong |
| Minimum | 0.57% | 1.5% |
| Maximum | 24.5% | 16.6% |
| Range | 23.9% | 15.1% |
| Mean | 10.5% | 8.8% |
| Median | 11.3% | 8.9% |
| Interquartile 25% (IQ1) | 6.9% | 6.7% |
| Interquartile 75% (IQ3) | 13.6% | 10.1% |
| Interquartile Range (IQR) | 6.6% | 3.4% |
| Standard Deviation (Sample) | 4.9% | 3.0% |
| Standard Deviation (Population) | 4.9% | 3.0% |
Similar Demographics by Poverty
Demographics Similar to Immigrants from Kazakhstan by Poverty
In terms of poverty, the demographic groups most similar to Immigrants from Kazakhstan are Samoan (12.0%, a difference of 0.040%), Immigrants from Germany (12.0%, a difference of 0.050%), Immigrants from Malaysia (12.0%, a difference of 0.050%), Immigrants from Bosnia and Herzegovina (12.0%, a difference of 0.17%), and Afghan (12.0%, a difference of 0.33%).
| Demographics | Rating | Rank | Poverty |
| Brazilians | 79.7 /100 | #143 | Good 11.9% |
| Icelanders | 77.9 /100 | #144 | Good 11.9% |
| Syrians | 75.1 /100 | #145 | Good 12.0% |
| Afghans | 74.9 /100 | #146 | Good 12.0% |
| Immigrants | Bosnia and Herzegovina | 73.7 /100 | #147 | Good 12.0% |
| Immigrants | Germany | 72.7 /100 | #148 | Good 12.0% |
| Immigrants | Malaysia | 72.7 /100 | #149 | Good 12.0% |
| Immigrants | Kazakhstan | 72.3 /100 | #150 | Good 12.0% |
| Samoans | 71.9 /100 | #151 | Good 12.0% |
| Armenians | 67.6 /100 | #152 | Good 12.1% |
| Immigrants | Northern Africa | 63.9 /100 | #153 | Good 12.1% |
| Guamanians/Chamorros | 63.9 /100 | #154 | Good 12.1% |
| Hungarians | 63.6 /100 | #155 | Good 12.2% |
| Scotch-Irish | 62.6 /100 | #156 | Good 12.2% |
| Costa Ricans | 62.2 /100 | #157 | Good 12.2% |
Demographics Similar to Immigrants from Hong Kong by Poverty
In terms of poverty, the demographic groups most similar to Immigrants from Hong Kong are Bhutanese (10.4%, a difference of 0.22%), Immigrants from Bolivia (10.4%, a difference of 0.31%), Bolivian (10.4%, a difference of 0.32%), Immigrants from Lithuania (10.3%, a difference of 0.57%), and Lithuanian (10.5%, a difference of 0.62%).
| Demographics | Rating | Rank | Poverty |
| Assyrians/Chaldeans/Syriacs | 99.9 /100 | #6 | Exceptional 10.1% |
| Filipinos | 99.9 /100 | #7 | Exceptional 10.1% |
| Maltese | 99.9 /100 | #8 | Exceptional 10.2% |
| Immigrants | South Central Asia | 99.9 /100 | #9 | Exceptional 10.2% |
| Bulgarians | 99.9 /100 | #10 | Exceptional 10.2% |
| Immigrants | Lithuania | 99.9 /100 | #11 | Exceptional 10.3% |
| Bhutanese | 99.8 /100 | #12 | Exceptional 10.4% |
| Immigrants | Hong Kong | 99.8 /100 | #13 | Exceptional 10.4% |
| Immigrants | Bolivia | 99.8 /100 | #14 | Exceptional 10.4% |
| Bolivians | 99.8 /100 | #15 | Exceptional 10.4% |
| Lithuanians | 99.8 /100 | #16 | Exceptional 10.5% |
| Norwegians | 99.8 /100 | #17 | Exceptional 10.5% |
| Latvians | 99.8 /100 | #18 | Exceptional 10.5% |
| Immigrants | Scotland | 99.7 /100 | #19 | Exceptional 10.6% |
| Immigrants | North Macedonia | 99.7 /100 | #20 | Exceptional 10.6% |