Immigrants from Kazakhstan vs Immigrants from Bolivia Child Poverty Among Boys Under 16
COMPARE
Immigrants from Kazakhstan
Immigrants from Bolivia
Child Poverty Among Boys Under 16
Child Poverty Among Boys Under 16 Comparison
Immigrants from Kazakhstan
Immigrants from Bolivia
15.5%
CHILD POVERTY AMONG BOYS UNDER 16
88.7/ 100
METRIC RATING
132nd/ 347
METRIC RANK
13.5%
CHILD POVERTY AMONG BOYS UNDER 16
99.8/ 100
METRIC RATING
26th/ 347
METRIC RANK
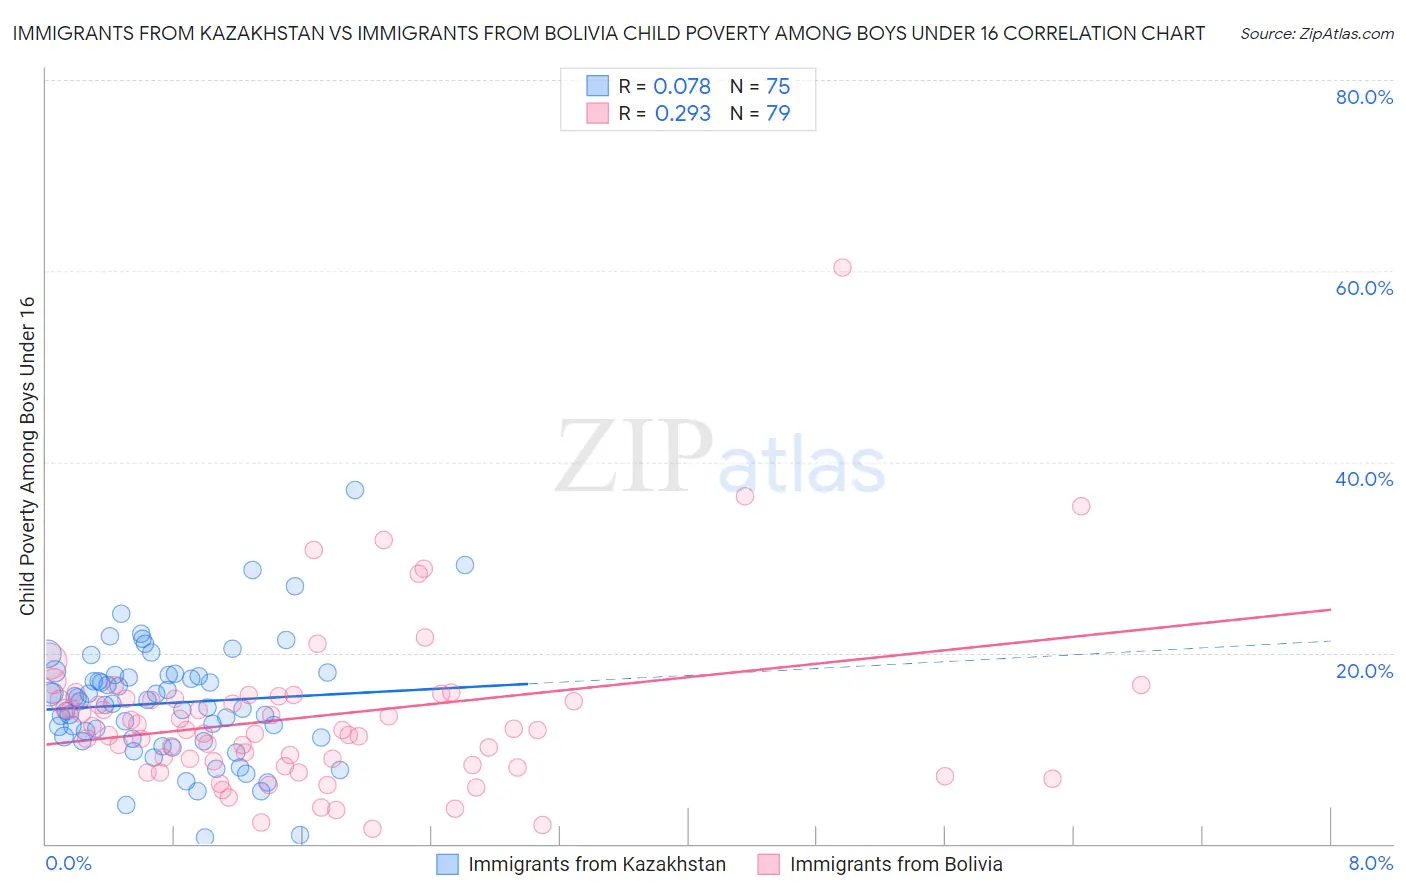
Immigrants from Kazakhstan vs Immigrants from Bolivia Child Poverty Among Boys Under 16 Correlation Chart
The statistical analysis conducted on geographies consisting of 123,737,741 people shows a slight positive correlation between the proportion of Immigrants from Kazakhstan and poverty level among boys under the age of 16 in the United States with a correlation coefficient (R) of 0.078 and weighted average of 15.5%. Similarly, the statistical analysis conducted on geographies consisting of 157,748,153 people shows a weak positive correlation between the proportion of Immigrants from Bolivia and poverty level among boys under the age of 16 in the United States with a correlation coefficient (R) of 0.293 and weighted average of 13.5%, a difference of 14.6%.
Child Poverty Among Boys Under 16 Correlation Summary
| Measurement | Immigrants from Kazakhstan | Immigrants from Bolivia |
| Minimum | 0.67% | 1.6% |
| Maximum | 37.0% | 60.4% |
| Range | 36.4% | 58.8% |
| Mean | 14.7% | 13.3% |
| Median | 14.7% | 11.9% |
| Interquartile 25% (IQ1) | 11.0% | 8.2% |
| Interquartile 75% (IQ3) | 17.6% | 15.2% |
| Interquartile Range (IQR) | 6.7% | 7.0% |
| Standard Deviation (Sample) | 6.2% | 8.8% |
| Standard Deviation (Population) | 6.1% | 8.8% |
Similar Demographics by Child Poverty Among Boys Under 16
Demographics Similar to Immigrants from Kazakhstan by Child Poverty Among Boys Under 16
In terms of child poverty among boys under 16, the demographic groups most similar to Immigrants from Kazakhstan are Welsh (15.5%, a difference of 0.11%), Peruvian (15.5%, a difference of 0.15%), Portuguese (15.5%, a difference of 0.33%), Icelander (15.5%, a difference of 0.34%), and Immigrants from Western Europe (15.4%, a difference of 0.43%).
| Demographics | Rating | Rank | Child Poverty Among Boys Under 16 |
| Czechoslovakians | 92.1 /100 | #125 | Exceptional 15.3% |
| Palestinians | 91.3 /100 | #126 | Exceptional 15.4% |
| Carpatho Rusyns | 91.1 /100 | #127 | Exceptional 15.4% |
| Canadians | 90.6 /100 | #128 | Exceptional 15.4% |
| Immigrants | Brazil | 90.3 /100 | #129 | Exceptional 15.4% |
| Mongolians | 90.2 /100 | #130 | Exceptional 15.4% |
| Immigrants | Western Europe | 90.0 /100 | #131 | Exceptional 15.4% |
| Immigrants | Kazakhstan | 88.7 /100 | #132 | Excellent 15.5% |
| Welsh | 88.3 /100 | #133 | Excellent 15.5% |
| Peruvians | 88.1 /100 | #134 | Excellent 15.5% |
| Portuguese | 87.5 /100 | #135 | Excellent 15.5% |
| Icelanders | 87.5 /100 | #136 | Excellent 15.5% |
| Immigrants | Spain | 87.1 /100 | #137 | Excellent 15.6% |
| Immigrants | Southern Europe | 86.5 /100 | #138 | Excellent 15.6% |
| Albanians | 86.5 /100 | #139 | Excellent 15.6% |
Demographics Similar to Immigrants from Bolivia by Child Poverty Among Boys Under 16
In terms of child poverty among boys under 16, the demographic groups most similar to Immigrants from Bolivia are Okinawan (13.5%, a difference of 0.080%), Asian (13.5%, a difference of 0.080%), Eastern European (13.5%, a difference of 0.15%), Immigrants from Lithuania (13.5%, a difference of 0.20%), and Cypriot (13.6%, a difference of 0.34%).
| Demographics | Rating | Rank | Child Poverty Among Boys Under 16 |
| Bolivians | 99.9 /100 | #19 | Exceptional 13.3% |
| Indians (Asian) | 99.9 /100 | #20 | Exceptional 13.3% |
| Immigrants | Eastern Asia | 99.9 /100 | #21 | Exceptional 13.3% |
| Tongans | 99.9 /100 | #22 | Exceptional 13.4% |
| Latvians | 99.9 /100 | #23 | Exceptional 13.4% |
| Immigrants | Lithuania | 99.8 /100 | #24 | Exceptional 13.5% |
| Okinawans | 99.8 /100 | #25 | Exceptional 13.5% |
| Immigrants | Bolivia | 99.8 /100 | #26 | Exceptional 13.5% |
| Asians | 99.8 /100 | #27 | Exceptional 13.5% |
| Eastern Europeans | 99.8 /100 | #28 | Exceptional 13.5% |
| Cypriots | 99.8 /100 | #29 | Exceptional 13.6% |
| Swedes | 99.8 /100 | #30 | Exceptional 13.6% |
| Turks | 99.8 /100 | #31 | Exceptional 13.6% |
| Immigrants | China | 99.8 /100 | #32 | Exceptional 13.6% |
| Danes | 99.8 /100 | #33 | Exceptional 13.6% |