Immigrants from Jordan vs Luxembourger Female Poverty Among 25-34 Year Olds

COMPARE

Immigrants from Jordan
Race
Ancestry
AfghanAfricanAlaska NativeAlaskan AthabascanAlbanianAleutAlsatianAmericanApacheArabArapahoArgentineanArmenianAssyrian/Chaldean/SyriacAustralianAustrianBahamianBangladeshiBarbadianBasqueBelgianBelizeanBermudanBhutaneseBlackfeetBolivianBrazilianBritishBritish West IndianBulgarianBurmeseCajunCambodianCanadianCape VerdeanCarpatho RusynCelticCentral AmericanCentral American IndianCherokeeCheyenneChickasawChileanChineseChippewaChoctawColombianColvilleComancheCosta RicanCreeCreekCroatianCrowCubanCypriotCzechCzechoslovakianDanishDelawareDominicanDutchDutch West IndianEastern EuropeanEcuadorianEgyptianEnglishEstonianEthiopianEuropeanFijianFilipinoFinnishFrenchFrench American IndianFrench CanadianGermanGerman RussianGhanaianGreekGuamanian/ChamorroGuatemalanGuyaneseHaitianHmongHonduranHopiHoumaHungarianIcelanderIndian (Asian)IndonesianInupiatIranianIraqiIrishIroquoisIsraeliItalianJamaicanJapaneseJordanianKenyanKiowaKoreanLaotianLatvianLebaneseLiberianLithuanianLumbeeMacedonianMalaysianMalteseMarshalleseMenomineeMexicanMexican American IndianMongolianMoroccanNative HawaiianNavajoNepaleseNew ZealanderNicaraguanNigerianNorthern EuropeanNorwegianOkinawanOsageOttawaPaiutePakistaniPalestinianPanamanianParaguayanPennsylvania GermanPeruvianPimaPolishPortuguesePotawatomiPuebloPuerto RicanPuget Sound SalishRomanianRussianSalvadoranSamoanScandinavianScotch-IrishScottishSeminoleSenegaleseSerbianShoshoneSierra LeoneanSiouxSlavicSlovakSloveneSomaliSouth AfricanSouth AmericanSouth American IndianSoviet UnionSpaniardSpanishSpanish AmericanSpanish American IndianSri LankanSubsaharan AfricanSudaneseSwedishSwissSyrianTaiwaneseThaiTlingit-HaidaTohono O'OdhamTonganTrinidadian and TobagonianTsimshianTurkishU.S. Virgin IslanderUgandanUkrainianUruguayanUteVenezuelanVietnameseWelshWest IndianYakamaYaquiYugoslavianYumanYup'ikZimbabwean
Immigration
NonimmigrantsImmigrantsAfghanistanAfricaAlbaniaArgentinaArmeniaAsiaAustraliaAustriaBahamasBangladeshBarbadosBelarusBelgiumBelizeBoliviaBosnia and HerzegovinaBrazilBulgariaBurma/MyanmarCabo VerdeCambodiaCameroonCanadaCaribbeanCentral AmericaChileChinaColombiaCongoCosta RicaCroatiaCubaCzechoslovakiaDenmarkDominicaDominican RepublicEastern AfricaEastern AsiaEastern EuropeEcuadorEgyptEl SalvadorEnglandEritreaEthiopiaEuropeFijiFranceGermanyGhanaGreeceGrenadaGuatemalaGuyanaHaitiHondurasHong KongHungaryIndiaIndonesiaIranIraqIrelandIsraelItalyJamaicaJapanJordanKazakhstanKenyaKoreaKuwaitLaosLatin AmericaLatviaLebanonLiberiaLithuaniaMalaysiaMexicoMicronesiaMiddle AfricaMoldovaMoroccoNepalNetherlandsNicaraguaNigeriaNorth AmericaNorth MacedoniaNorthern AfricaNorthern EuropeNorwayOceaniaPakistanPanamaPeruPhilippinesPolandPortugalRomaniaRussiaSaudi ArabiaScotlandSenegalSerbiaSierra LeoneSingaporeSomaliaSouth AfricaSouth AmericaSouth Central AsiaSouth Eastern AsiaSouthern EuropeSpainSri LankaSt. Vincent and the GrenadinesSudanSwedenSwitzerlandSyriaTaiwanThailandTrinidad and TobagoTurkeyUgandaUkraineUruguayUzbekistanVenezuelaVietnamWest IndiesWestern AfricaWestern AsiaWestern EuropeYemenZaireZimbabweAzores
Luxembourger
Race
Ancestry
AfghanAfricanAlaska NativeAlaskan AthabascanAlbanianAleutAlsatianAmericanApacheArabArapahoArgentineanArmenianAssyrian/Chaldean/SyriacAustralianAustrianBahamianBangladeshiBarbadianBasqueBelgianBelizeanBermudanBhutaneseBlackfeetBolivianBrazilianBritishBritish West IndianBulgarianBurmeseCajunCambodianCanadianCape VerdeanCarpatho RusynCelticCentral AmericanCentral American IndianCherokeeCheyenneChickasawChileanChineseChippewaChoctawColombianColvilleComancheCosta RicanCreeCreekCroatianCrowCubanCypriotCzechCzechoslovakianDanishDelawareDominicanDutchDutch West IndianEastern EuropeanEcuadorianEgyptianEnglishEstonianEthiopianEuropeanFijianFilipinoFinnishFrenchFrench American IndianFrench CanadianGermanGerman RussianGhanaianGreekGuamanian/ChamorroGuatemalanGuyaneseHaitianHmongHonduranHopiHoumaHungarianIcelanderIndian (Asian)IndonesianInupiatIranianIraqiIrishIroquoisIsraeliItalianJamaicanJapaneseJordanianKenyanKiowaKoreanLaotianLatvianLebaneseLiberianLithuanianLumbeeLuxembourgerMacedonianMalaysianMalteseMarshalleseMenomineeMexicanMexican American IndianMongolianMoroccanNative HawaiianNavajoNepaleseNew ZealanderNicaraguanNigerianNorthern EuropeanNorwegianOkinawanOsageOttawaPaiutePakistaniPalestinianPanamanianParaguayanPennsylvania GermanPeruvianPimaPolishPortuguesePotawatomiPuebloPuerto RicanPuget Sound SalishRomanianRussianSalvadoranSamoanScandinavianScotch-IrishScottishSeminoleSenegaleseSerbianShoshoneSierra LeoneanSiouxSlavicSlovakSloveneSomaliSouth AfricanSouth AmericanSouth American IndianSoviet UnionSpaniardSpanishSpanish AmericanSpanish American IndianSri LankanSubsaharan AfricanSudaneseSwedishSwissSyrianTaiwaneseThaiTlingit-HaidaTohono O'OdhamTonganTrinidadian and TobagonianTsimshianTurkishU.S. Virgin IslanderUgandanUkrainianUruguayanUteVenezuelanVietnameseWelshWest IndianYakamaYaquiYugoslavianYumanYup'ikZimbabwean
Immigration
NonimmigrantsImmigrantsAfghanistanAfricaAlbaniaArgentinaArmeniaAsiaAustraliaAustriaBahamasBangladeshBarbadosBelarusBelgiumBelizeBoliviaBosnia and HerzegovinaBrazilBulgariaBurma/MyanmarCabo VerdeCambodiaCameroonCanadaCaribbeanCentral AmericaChileChinaColombiaCongoCosta RicaCroatiaCubaCzechoslovakiaDenmarkDominicaDominican RepublicEastern AfricaEastern AsiaEastern EuropeEcuadorEgyptEl SalvadorEnglandEritreaEthiopiaEuropeFijiFranceGermanyGhanaGreeceGrenadaGuatemalaGuyanaHaitiHondurasHong KongHungaryIndiaIndonesiaIranIraqIrelandIsraelItalyJamaicaJapanKazakhstanKenyaKoreaKuwaitLaosLatin AmericaLatviaLebanonLiberiaLithuaniaMalaysiaMexicoMicronesiaMiddle AfricaMoldovaMoroccoNepalNetherlandsNicaraguaNigeriaNorth AmericaNorth MacedoniaNorthern AfricaNorthern EuropeNorwayOceaniaPakistanPanamaPeruPhilippinesPolandPortugalRomaniaRussiaSaudi ArabiaScotlandSenegalSerbiaSierra LeoneSingaporeSomaliaSouth AfricaSouth AmericaSouth Central AsiaSouth Eastern AsiaSouthern EuropeSpainSri LankaSt. Vincent and the GrenadinesSudanSwedenSwitzerlandSyriaTaiwanThailandTrinidad and TobagoTurkeyUgandaUkraineUruguayUzbekistanVenezuelaVietnamWest IndiesWestern AfricaWestern AsiaWestern EuropeYemenZaireZimbabweAzores
Female Poverty Among 25-34 Year Olds
Income
Poverty
Unemployment
Labor Participation
Family Structure
Vehicle Availability
Education Level
Disability

Female Poverty Among 25-34 Year Olds Comparison

Immigrants from Jordan

Luxembourgers

Exceptional
Exceptional
12.4%
FEMALE POVERTY AMONG 25-34 YEAR OLDS
98.5/ 100
METRIC RATING
79th/ 347
METRIC RANK
12.1%
FEMALE POVERTY AMONG 25-34 YEAR OLDS
99.5/ 100
METRIC RATING
56th/ 347
METRIC RANK

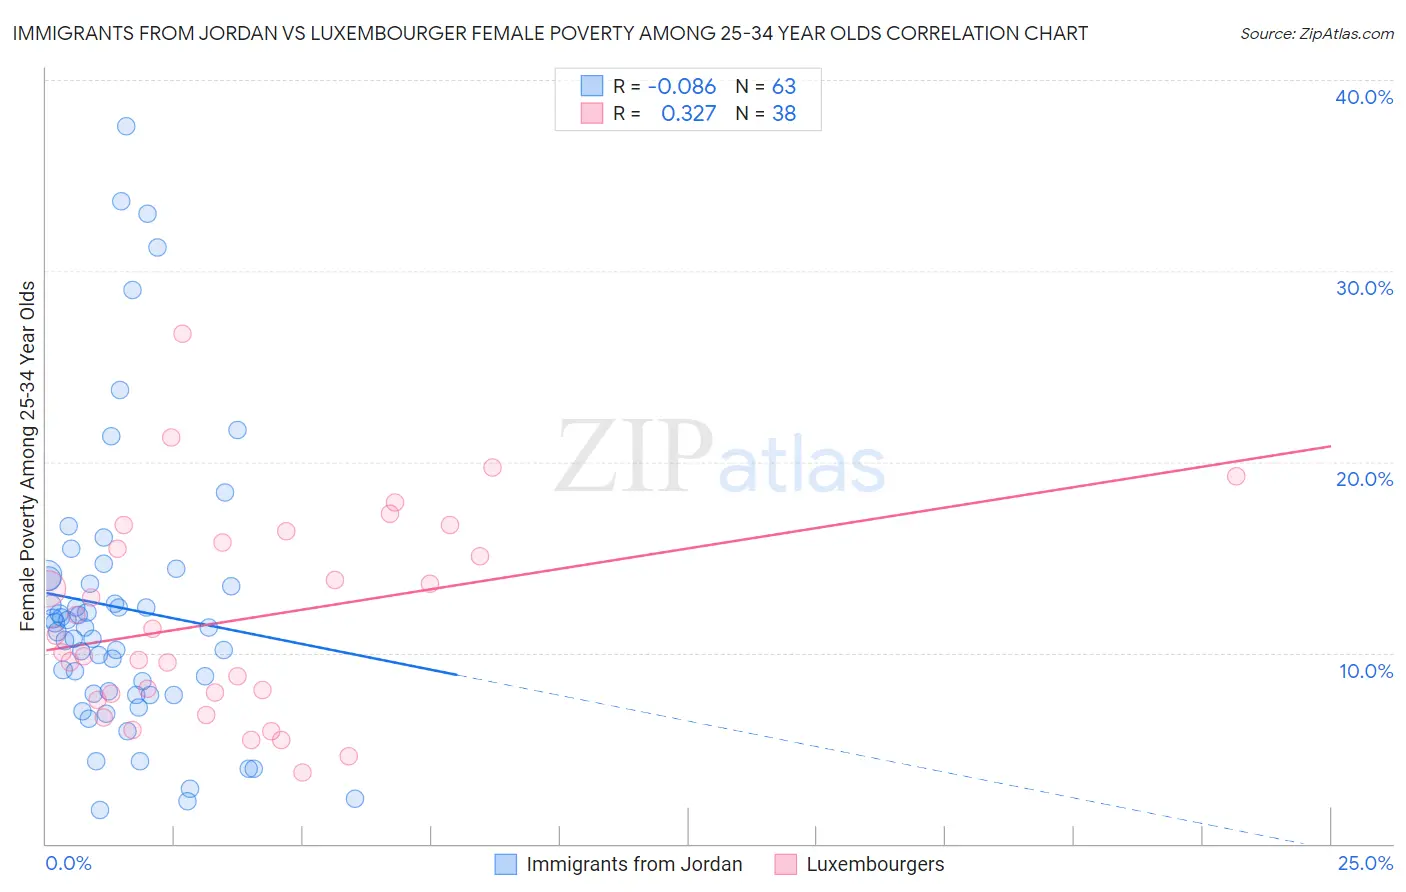
Immigrants from Jordan vs Luxembourger Female Poverty Among 25-34 Year Olds Correlation Chart

The statistical analysis conducted on geographies consisting of 180,469,872 people shows a slight negative correlation between the proportion of Immigrants from Jordan and poverty level among females between the ages 25 and 34 in the United States with a correlation coefficient (R) of -0.086 and weighted average of 12.4%. Similarly, the statistical analysis conducted on geographies consisting of 143,147,078 people shows a mild positive correlation between the proportion of Luxembourgers and poverty level among females between the ages 25 and 34 in the United States with a correlation coefficient (R) of 0.327 and weighted average of 12.1%, a difference of 2.4%.
Immigrants from Jordan vs Luxembourger Female Poverty Among 25-34 Year Olds

Female Poverty Among 25-34 Year Olds Correlation Summary

MeasurementImmigrants from JordanLuxembourger
Minimum1.8%3.7%
Maximum37.6%26.7%
Range35.8%23.0%
Mean12.3%11.8%
Median11.3%10.5%
Interquartile 25% (IQ1)7.8%7.8%
Interquartile 75% (IQ3)13.9%15.8%
Interquartile Range (IQR)6.1%8.0%
Standard Deviation (Sample)7.6%5.3%
Standard Deviation (Population)7.5%5.2%

Similar Demographics by Female Poverty Among 25-34 Year Olds

Demographics Similar to Immigrants from Jordan by Female Poverty Among 25-34 Year Olds

In terms of female poverty among 25-34 year olds, the demographic groups most similar to Immigrants from Jordan are Immigrants from Ukraine (12.3%, a difference of 0.27%), Immigrants from Malaysia (12.4%, a difference of 0.27%), Immigrants from Italy (12.3%, a difference of 0.50%), Immigrants from Kazakhstan (12.4%, a difference of 0.51%), and Ethiopian (12.4%, a difference of 0.59%).
DemographicsRating | RankFemale Poverty Among 25-34 Year Olds
Lithuanians
99.1
/100
|
#72
Exceptional
12.2%
Immigrants | Vietnam
98.9
/100
|
#73
Exceptional
12.3%
Immigrants | Sweden
98.9
/100
|
#74
Exceptional
12.3%
Estonians
98.9
/100
|
#75
Exceptional
12.3%
Greeks
98.9
/100
|
#76
Exceptional
12.3%
Immigrants | Italy
98.8
/100
|
#77
Exceptional
12.3%
Immigrants | Ukraine
98.6
/100
|
#78
Exceptional
12.3%
Immigrants | Jordan
98.5
/100
|
#79
Exceptional
12.4%
Immigrants | Malaysia
98.3
/100
|
#80
Exceptional
12.4%
Immigrants | Kazakhstan
98.1
/100
|
#81
Exceptional
12.4%
Ethiopians
98.0
/100
|
#82
Exceptional
12.4%
Albanians
97.7
/100
|
#83
Exceptional
12.5%
Immigrants | Latvia
97.7
/100
|
#84
Exceptional
12.5%
Immigrants | South Eastern Asia
97.6
/100
|
#85
Exceptional
12.5%
Croatians
97.5
/100
|
#86
Exceptional
12.5%

Demographics Similar to Luxembourgers by Female Poverty Among 25-34 Year Olds

In terms of female poverty among 25-34 year olds, the demographic groups most similar to Luxembourgers are Jordanian (12.1%, a difference of 0.020%), Immigrants from Romania (12.1%, a difference of 0.22%), Russian (12.1%, a difference of 0.23%), Immigrants from Northern Europe (12.1%, a difference of 0.31%), and Immigrants from Philippines (12.0%, a difference of 0.33%).
DemographicsRating | RankFemale Poverty Among 25-34 Year Olds
Immigrants | Egypt
99.6
/100
|
#49
Exceptional
12.0%
Immigrants | Croatia
99.6
/100
|
#50
Exceptional
12.0%
Paraguayans
99.6
/100
|
#51
Exceptional
12.0%
Immigrants | Eastern Europe
99.6
/100
|
#52
Exceptional
12.0%
Immigrants | Israel
99.6
/100
|
#53
Exceptional
12.0%
Eastern Europeans
99.6
/100
|
#54
Exceptional
12.0%
Immigrants | Philippines
99.5
/100
|
#55
Exceptional
12.0%
Luxembourgers
99.5
/100
|
#56
Exceptional
12.1%
Jordanians
99.4
/100
|
#57
Exceptional
12.1%
Immigrants | Romania
99.4
/100
|
#58
Exceptional
12.1%
Russians
99.4
/100
|
#59
Exceptional
12.1%
Immigrants | Northern Europe
99.4
/100
|
#60
Exceptional
12.1%
Immigrants | Czechoslovakia
99.4
/100
|
#61
Exceptional
12.1%
Immigrants | Moldova
99.3
/100
|
#62
Exceptional
12.1%
Soviet Union
99.3
/100
|
#63
Exceptional
12.1%