Immigrants from Jordan vs Immigrants from Moldova Female Poverty Among 25-34 Year Olds
COMPARE
Immigrants from Jordan
Immigrants from Moldova
Female Poverty Among 25-34 Year Olds
Female Poverty Among 25-34 Year Olds Comparison
Immigrants from Jordan
Immigrants from Moldova
12.4%
FEMALE POVERTY AMONG 25-34 YEAR OLDS
98.5/ 100
METRIC RATING
79th/ 347
METRIC RANK
12.1%
FEMALE POVERTY AMONG 25-34 YEAR OLDS
99.3/ 100
METRIC RATING
62nd/ 347
METRIC RANK
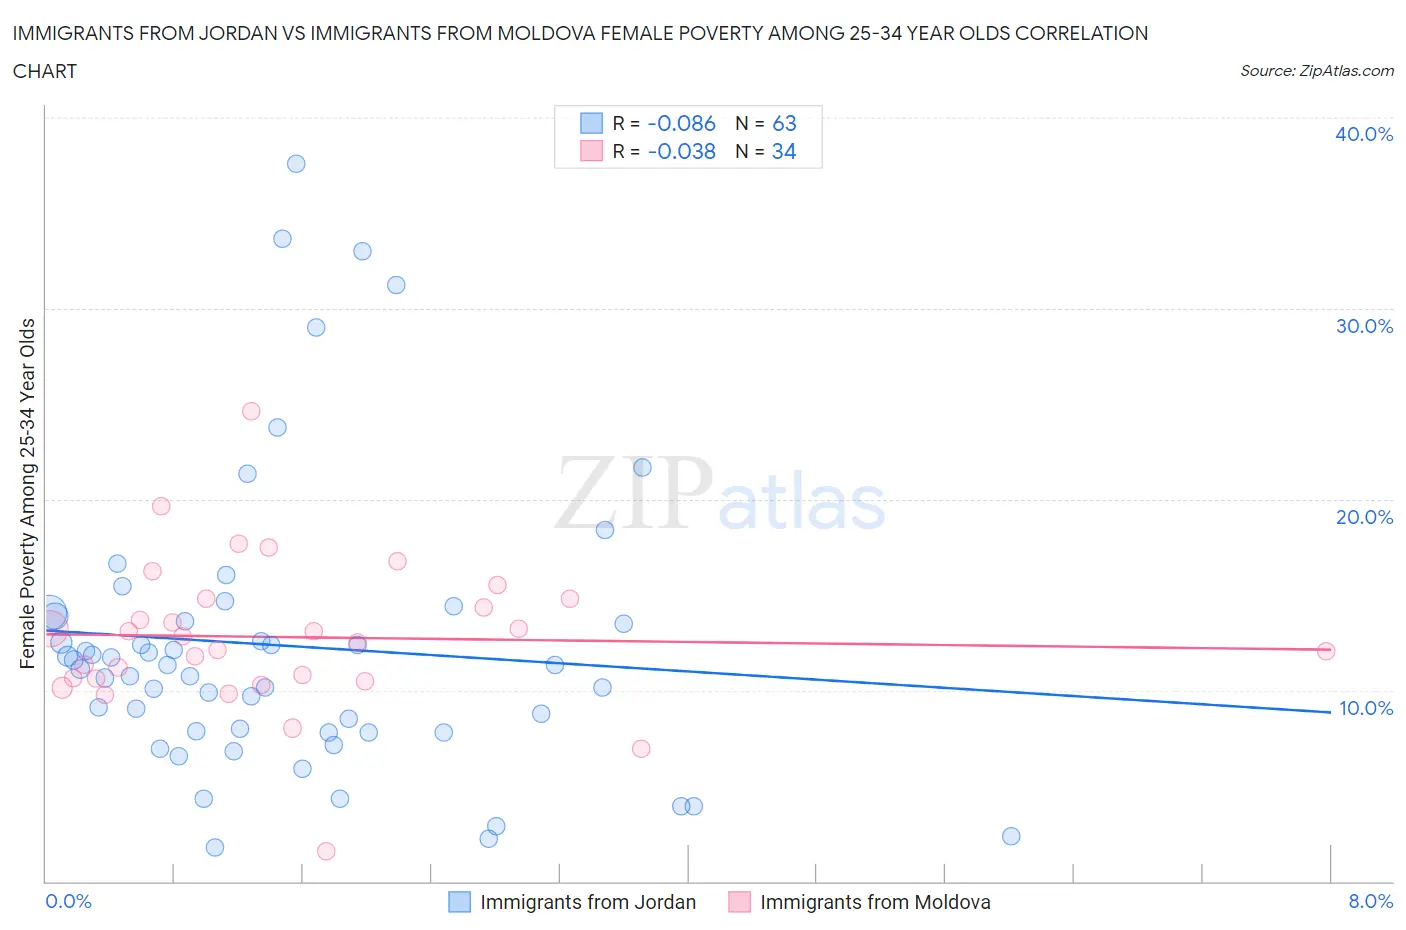
Immigrants from Jordan vs Immigrants from Moldova Female Poverty Among 25-34 Year Olds Correlation Chart
The statistical analysis conducted on geographies consisting of 180,469,872 people shows a slight negative correlation between the proportion of Immigrants from Jordan and poverty level among females between the ages 25 and 34 in the United States with a correlation coefficient (R) of -0.086 and weighted average of 12.4%. Similarly, the statistical analysis conducted on geographies consisting of 123,404,281 people shows no correlation between the proportion of Immigrants from Moldova and poverty level among females between the ages 25 and 34 in the United States with a correlation coefficient (R) of -0.038 and weighted average of 12.1%, a difference of 1.9%.
Female Poverty Among 25-34 Year Olds Correlation Summary
| Measurement | Immigrants from Jordan | Immigrants from Moldova |
| Minimum | 1.8% | 1.6% |
| Maximum | 37.6% | 24.6% |
| Range | 35.8% | 23.0% |
| Mean | 12.3% | 12.8% |
| Median | 11.3% | 12.7% |
| Interquartile 25% (IQ1) | 7.8% | 10.6% |
| Interquartile 75% (IQ3) | 13.9% | 14.8% |
| Interquartile Range (IQR) | 6.1% | 4.2% |
| Standard Deviation (Sample) | 7.6% | 4.0% |
| Standard Deviation (Population) | 7.5% | 3.9% |
Demographics Similar to Immigrants from Jordan and Immigrants from Moldova by Female Poverty Among 25-34 Year Olds
In terms of female poverty among 25-34 year olds, the demographic groups most similar to Immigrants from Jordan are Immigrants from Ukraine (12.3%, a difference of 0.27%), Immigrants from Malaysia (12.4%, a difference of 0.27%), Immigrants from Italy (12.3%, a difference of 0.50%), Greek (12.3%, a difference of 0.67%), and Estonian (12.3%, a difference of 0.72%). Similarly, the demographic groups most similar to Immigrants from Moldova are Soviet Union (12.1%, a difference of 0.010%), Immigrants from Czechoslovakia (12.1%, a difference of 0.17%), Immigrants from Northern Europe (12.1%, a difference of 0.19%), Immigrants from Russia (12.2%, a difference of 0.25%), and Armenian (12.2%, a difference of 0.27%).
| Demographics | Rating | Rank | Female Poverty Among 25-34 Year Olds |
| Immigrants | Northern Europe | 99.4 /100 | #60 | Exceptional 12.1% |
| Immigrants | Czechoslovakia | 99.4 /100 | #61 | Exceptional 12.1% |
| Immigrants | Moldova | 99.3 /100 | #62 | Exceptional 12.1% |
| Soviet Union | 99.3 /100 | #63 | Exceptional 12.1% |
| Immigrants | Russia | 99.2 /100 | #64 | Exceptional 12.2% |
| Armenians | 99.2 /100 | #65 | Exceptional 12.2% |
| Immigrants | Europe | 99.2 /100 | #66 | Exceptional 12.2% |
| Laotians | 99.2 /100 | #67 | Exceptional 12.2% |
| Sri Lankans | 99.1 /100 | #68 | Exceptional 12.2% |
| Immigrants | Lebanon | 99.1 /100 | #69 | Exceptional 12.2% |
| Immigrants | Belgium | 99.1 /100 | #70 | Exceptional 12.2% |
| Immigrants | Scotland | 99.1 /100 | #71 | Exceptional 12.2% |
| Lithuanians | 99.1 /100 | #72 | Exceptional 12.2% |
| Immigrants | Vietnam | 98.9 /100 | #73 | Exceptional 12.3% |
| Immigrants | Sweden | 98.9 /100 | #74 | Exceptional 12.3% |
| Estonians | 98.9 /100 | #75 | Exceptional 12.3% |
| Greeks | 98.9 /100 | #76 | Exceptional 12.3% |
| Immigrants | Italy | 98.8 /100 | #77 | Exceptional 12.3% |
| Immigrants | Ukraine | 98.6 /100 | #78 | Exceptional 12.3% |
| Immigrants | Jordan | 98.5 /100 | #79 | Exceptional 12.4% |
| Immigrants | Malaysia | 98.3 /100 | #80 | Exceptional 12.4% |