Croatian vs Immigrants from Western Europe Seniors Poverty Over the Age of 65
COMPARE
Croatian
Immigrants from Western Europe
Seniors Poverty Over the Age of 65
Seniors Poverty Over the Age of 65 Comparison
Croatians
Immigrants from Western Europe
9.1%
SENIORS POVERTY OVER THE AGE OF 65
99.9/ 100
METRIC RATING
13th/ 347
METRIC RANK
10.4%
SENIORS POVERTY OVER THE AGE OF 65
91.1/ 100
METRIC RATING
119th/ 347
METRIC RANK
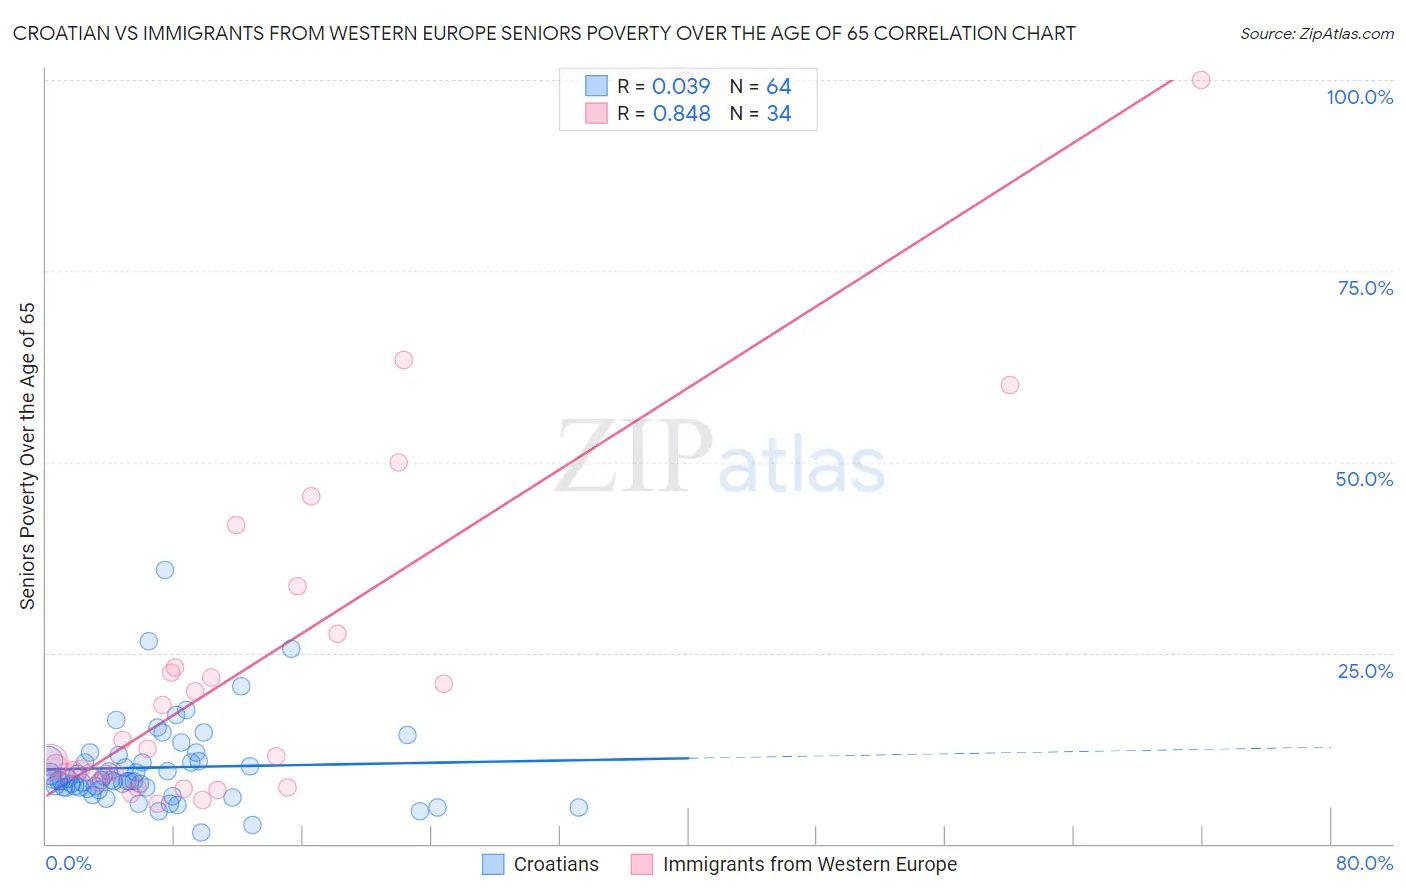
Croatian vs Immigrants from Western Europe Seniors Poverty Over the Age of 65 Correlation Chart
The statistical analysis conducted on geographies consisting of 374,546,245 people shows no correlation between the proportion of Croatians and poverty level among seniors over the age of 65 in the United States with a correlation coefficient (R) of 0.039 and weighted average of 9.1%. Similarly, the statistical analysis conducted on geographies consisting of 491,602,141 people shows a very strong positive correlation between the proportion of Immigrants from Western Europe and poverty level among seniors over the age of 65 in the United States with a correlation coefficient (R) of 0.848 and weighted average of 10.4%, a difference of 13.7%.
Seniors Poverty Over the Age of 65 Correlation Summary
| Measurement | Croatian | Immigrants from Western Europe |
| Minimum | 1.4% | 5.2% |
| Maximum | 35.8% | 100.0% |
| Range | 34.4% | 94.8% |
| Mean | 10.0% | 24.1% |
| Median | 8.3% | 12.0% |
| Interquartile 25% (IQ1) | 7.4% | 9.2% |
| Interquartile 75% (IQ3) | 10.8% | 27.6% |
| Interquartile Range (IQR) | 3.5% | 18.3% |
| Standard Deviation (Sample) | 5.7% | 24.9% |
| Standard Deviation (Population) | 5.7% | 24.5% |
Similar Demographics by Seniors Poverty Over the Age of 65
Demographics Similar to Croatians by Seniors Poverty Over the Age of 65
In terms of seniors poverty over the age of 65, the demographic groups most similar to Croatians are Polish (9.1%, a difference of 0.030%), Scandinavian (9.1%, a difference of 0.040%), Dutch (9.1%, a difference of 0.10%), Maltese (9.1%, a difference of 0.22%), and European (9.2%, a difference of 0.47%).
| Demographics | Rating | Rank | Seniors Poverty Over the Age of 65 |
| Danes | 100.0 /100 | #6 | Exceptional 8.8% |
| Germans | 100.0 /100 | #7 | Exceptional 9.0% |
| Czechs | 100.0 /100 | #8 | Exceptional 9.0% |
| English | 100.0 /100 | #9 | Exceptional 9.1% |
| Lithuanians | 100.0 /100 | #10 | Exceptional 9.1% |
| Maltese | 99.9 /100 | #11 | Exceptional 9.1% |
| Scandinavians | 99.9 /100 | #12 | Exceptional 9.1% |
| Croatians | 99.9 /100 | #13 | Exceptional 9.1% |
| Poles | 99.9 /100 | #14 | Exceptional 9.1% |
| Dutch | 99.9 /100 | #15 | Exceptional 9.1% |
| Europeans | 99.9 /100 | #16 | Exceptional 9.2% |
| Scottish | 99.9 /100 | #17 | Exceptional 9.2% |
| Slovaks | 99.9 /100 | #18 | Exceptional 9.2% |
| Swiss | 99.9 /100 | #19 | Exceptional 9.2% |
| Thais | 99.9 /100 | #20 | Exceptional 9.2% |
Demographics Similar to Immigrants from Western Europe by Seniors Poverty Over the Age of 65
In terms of seniors poverty over the age of 65, the demographic groups most similar to Immigrants from Western Europe are Immigrants from Bosnia and Herzegovina (10.4%, a difference of 0.060%), Immigrants from Iraq (10.4%, a difference of 0.10%), Immigrants from Moldova (10.4%, a difference of 0.11%), Okinawan (10.4%, a difference of 0.19%), and Lebanese (10.3%, a difference of 0.27%).
| Demographics | Rating | Rank | Seniors Poverty Over the Age of 65 |
| Immigrants | Korea | 93.3 /100 | #112 | Exceptional 10.3% |
| Immigrants | Romania | 93.3 /100 | #113 | Exceptional 10.3% |
| Immigrants | Denmark | 92.7 /100 | #114 | Exceptional 10.3% |
| Immigrants | Italy | 92.6 /100 | #115 | Exceptional 10.3% |
| Pakistanis | 92.2 /100 | #116 | Exceptional 10.3% |
| Lebanese | 92.0 /100 | #117 | Exceptional 10.3% |
| Okinawans | 91.7 /100 | #118 | Exceptional 10.4% |
| Immigrants | Western Europe | 91.1 /100 | #119 | Exceptional 10.4% |
| Immigrants | Bosnia and Herzegovina | 90.8 /100 | #120 | Exceptional 10.4% |
| Immigrants | Iraq | 90.7 /100 | #121 | Exceptional 10.4% |
| Immigrants | Moldova | 90.7 /100 | #122 | Exceptional 10.4% |
| Hmong | 90.0 /100 | #123 | Exceptional 10.4% |
| Asians | 89.9 /100 | #124 | Excellent 10.4% |
| Immigrants | Philippines | 89.4 /100 | #125 | Excellent 10.4% |
| Immigrants | Hungary | 89.1 /100 | #126 | Excellent 10.4% |