Delaware vs Immigrants from Western Europe Seniors Poverty Over the Age of 65
COMPARE
Delaware
Immigrants from Western Europe
Seniors Poverty Over the Age of 65
Seniors Poverty Over the Age of 65 Comparison
Delaware
Immigrants from Western Europe
10.2%
SENIORS POVERTY OVER THE AGE OF 65
94.5/ 100
METRIC RATING
102nd/ 347
METRIC RANK
10.4%
SENIORS POVERTY OVER THE AGE OF 65
91.1/ 100
METRIC RATING
119th/ 347
METRIC RANK
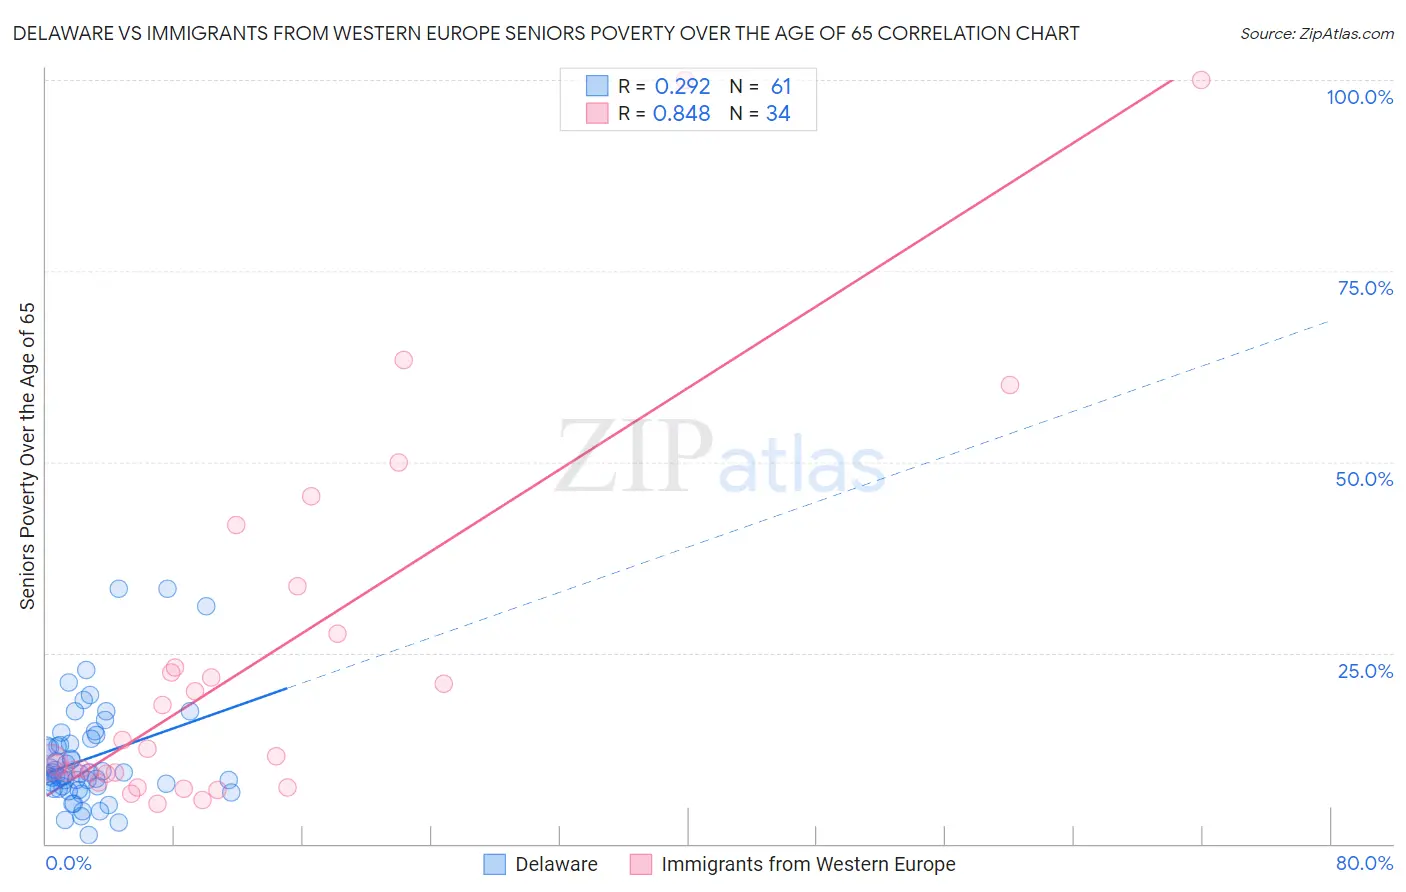
Delaware vs Immigrants from Western Europe Seniors Poverty Over the Age of 65 Correlation Chart
The statistical analysis conducted on geographies consisting of 96,151,479 people shows a weak positive correlation between the proportion of Delaware and poverty level among seniors over the age of 65 in the United States with a correlation coefficient (R) of 0.292 and weighted average of 10.2%. Similarly, the statistical analysis conducted on geographies consisting of 491,602,141 people shows a very strong positive correlation between the proportion of Immigrants from Western Europe and poverty level among seniors over the age of 65 in the United States with a correlation coefficient (R) of 0.848 and weighted average of 10.4%, a difference of 1.2%.
Seniors Poverty Over the Age of 65 Correlation Summary
| Measurement | Delaware | Immigrants from Western Europe |
| Minimum | 1.2% | 5.2% |
| Maximum | 33.3% | 100.0% |
| Range | 32.1% | 94.8% |
| Mean | 11.2% | 24.1% |
| Median | 9.2% | 12.0% |
| Interquartile 25% (IQ1) | 7.4% | 9.2% |
| Interquartile 75% (IQ3) | 13.4% | 27.6% |
| Interquartile Range (IQR) | 6.0% | 18.3% |
| Standard Deviation (Sample) | 6.7% | 24.9% |
| Standard Deviation (Population) | 6.6% | 24.5% |
Demographics Similar to Delaware and Immigrants from Western Europe by Seniors Poverty Over the Age of 65
In terms of seniors poverty over the age of 65, the demographic groups most similar to Delaware are Icelander (10.3%, a difference of 0.050%), South African (10.3%, a difference of 0.090%), Immigrants from Jordan (10.2%, a difference of 0.10%), Aleut (10.3%, a difference of 0.16%), and Kenyan (10.3%, a difference of 0.18%). Similarly, the demographic groups most similar to Immigrants from Western Europe are Immigrants from Bosnia and Herzegovina (10.4%, a difference of 0.060%), Okinawan (10.4%, a difference of 0.19%), Lebanese (10.3%, a difference of 0.27%), Pakistani (10.3%, a difference of 0.33%), and Immigrants from Italy (10.3%, a difference of 0.49%).
| Demographics | Rating | Rank | Seniors Poverty Over the Age of 65 |
| Marshallese | 95.3 /100 | #100 | Exceptional 10.2% |
| Immigrants | Jordan | 94.7 /100 | #101 | Exceptional 10.2% |
| Delaware | 94.5 /100 | #102 | Exceptional 10.2% |
| Icelanders | 94.4 /100 | #103 | Exceptional 10.3% |
| South Africans | 94.3 /100 | #104 | Exceptional 10.3% |
| Aleuts | 94.1 /100 | #105 | Exceptional 10.3% |
| Kenyans | 94.1 /100 | #106 | Exceptional 10.3% |
| Hawaiians | 93.9 /100 | #107 | Exceptional 10.3% |
| Immigrants | Croatia | 93.9 /100 | #108 | Exceptional 10.3% |
| Syrians | 93.8 /100 | #109 | Exceptional 10.3% |
| Immigrants | Zimbabwe | 93.5 /100 | #110 | Exceptional 10.3% |
| Immigrants | Belgium | 93.4 /100 | #111 | Exceptional 10.3% |
| Immigrants | Korea | 93.3 /100 | #112 | Exceptional 10.3% |
| Immigrants | Romania | 93.3 /100 | #113 | Exceptional 10.3% |
| Immigrants | Denmark | 92.7 /100 | #114 | Exceptional 10.3% |
| Immigrants | Italy | 92.6 /100 | #115 | Exceptional 10.3% |
| Pakistanis | 92.2 /100 | #116 | Exceptional 10.3% |
| Lebanese | 92.0 /100 | #117 | Exceptional 10.3% |
| Okinawans | 91.7 /100 | #118 | Exceptional 10.4% |
| Immigrants | Western Europe | 91.1 /100 | #119 | Exceptional 10.4% |
| Immigrants | Bosnia and Herzegovina | 90.8 /100 | #120 | Exceptional 10.4% |