Immigrants from Jamaica vs Immigrants from Egypt 11th Grade
COMPARE
Immigrants from Jamaica
Immigrants from Egypt
11th Grade
11th Grade Comparison
Immigrants from Jamaica
Immigrants from Egypt
91.2%
11TH GRADE
0.3/ 100
METRIC RATING
267th/ 347
METRIC RANK
92.8%
11TH GRADE
77.5/ 100
METRIC RATING
150th/ 347
METRIC RANK
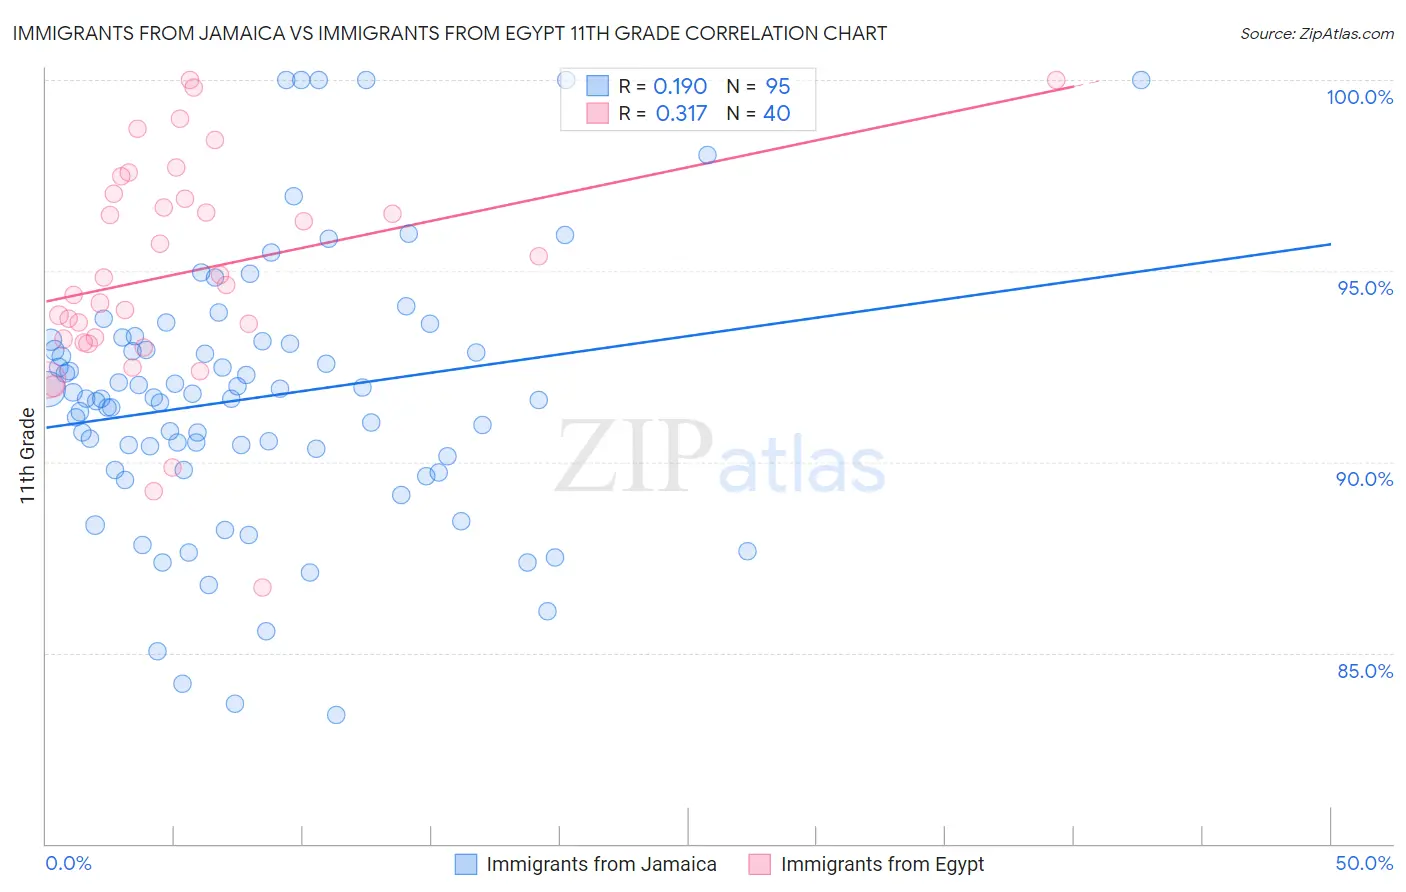
Immigrants from Jamaica vs Immigrants from Egypt 11th Grade Correlation Chart
The statistical analysis conducted on geographies consisting of 301,829,550 people shows a poor positive correlation between the proportion of Immigrants from Jamaica and percentage of population with at least 11th grade education in the United States with a correlation coefficient (R) of 0.190 and weighted average of 91.2%. Similarly, the statistical analysis conducted on geographies consisting of 245,484,455 people shows a mild positive correlation between the proportion of Immigrants from Egypt and percentage of population with at least 11th grade education in the United States with a correlation coefficient (R) of 0.317 and weighted average of 92.8%, a difference of 1.8%.
11th Grade Correlation Summary
| Measurement | Immigrants from Jamaica | Immigrants from Egypt |
| Minimum | 83.4% | 86.7% |
| Maximum | 100.0% | 100.0% |
| Range | 16.6% | 13.3% |
| Mean | 91.7% | 95.0% |
| Median | 91.7% | 94.7% |
| Interquartile 25% (IQ1) | 89.8% | 93.2% |
| Interquartile 75% (IQ3) | 93.2% | 97.0% |
| Interquartile Range (IQR) | 3.4% | 3.8% |
| Standard Deviation (Sample) | 3.5% | 2.9% |
| Standard Deviation (Population) | 3.5% | 2.9% |
Similar Demographics by 11th Grade
Demographics Similar to Immigrants from Jamaica by 11th Grade
In terms of 11th grade, the demographic groups most similar to Immigrants from Jamaica are Immigrants from Western Africa (91.2%, a difference of 0.010%), Yup'ik (91.2%, a difference of 0.030%), Pueblo (91.2%, a difference of 0.030%), Immigrants from Ghana (91.2%, a difference of 0.050%), and U.S. Virgin Islander (91.1%, a difference of 0.070%).
| Demographics | Rating | Rank | 11th Grade |
| Spanish Americans | 0.6 /100 | #260 | Tragic 91.4% |
| Taiwanese | 0.6 /100 | #261 | Tragic 91.3% |
| Immigrants | Uruguay | 0.5 /100 | #262 | Tragic 91.3% |
| Immigrants | Ghana | 0.3 /100 | #263 | Tragic 91.2% |
| Yup'ik | 0.3 /100 | #264 | Tragic 91.2% |
| Pueblo | 0.3 /100 | #265 | Tragic 91.2% |
| Immigrants | Western Africa | 0.3 /100 | #266 | Tragic 91.2% |
| Immigrants | Jamaica | 0.3 /100 | #267 | Tragic 91.2% |
| U.S. Virgin Islanders | 0.2 /100 | #268 | Tragic 91.1% |
| Ute | 0.2 /100 | #269 | Tragic 91.1% |
| Trinidadians and Tobagonians | 0.2 /100 | #270 | Tragic 91.1% |
| Immigrants | Peru | 0.1 /100 | #271 | Tragic 91.0% |
| West Indians | 0.1 /100 | #272 | Tragic 91.0% |
| Paiute | 0.1 /100 | #273 | Tragic 91.0% |
| Immigrants | Trinidad and Tobago | 0.1 /100 | #274 | Tragic 90.9% |
Demographics Similar to Immigrants from Egypt by 11th Grade
In terms of 11th grade, the demographic groups most similar to Immigrants from Egypt are Immigrants from Poland (92.8%, a difference of 0.010%), Iroquois (92.8%, a difference of 0.020%), Immigrants from Kenya (92.8%, a difference of 0.020%), Hmong (92.8%, a difference of 0.020%), and Pakistani (92.8%, a difference of 0.030%).
| Demographics | Rating | Rank | 11th Grade |
| Ugandans | 81.4 /100 | #143 | Excellent 92.9% |
| Assyrians/Chaldeans/Syriacs | 80.5 /100 | #144 | Excellent 92.8% |
| Pakistanis | 79.6 /100 | #145 | Good 92.8% |
| Iroquois | 79.1 /100 | #146 | Good 92.8% |
| Immigrants | Kenya | 78.7 /100 | #147 | Good 92.8% |
| Hmong | 78.6 /100 | #148 | Good 92.8% |
| Immigrants | Poland | 78.5 /100 | #149 | Good 92.8% |
| Immigrants | Egypt | 77.5 /100 | #150 | Good 92.8% |
| Potawatomi | 74.3 /100 | #151 | Good 92.8% |
| Iraqis | 74.2 /100 | #152 | Good 92.8% |
| Brazilians | 73.9 /100 | #153 | Good 92.8% |
| Osage | 73.4 /100 | #154 | Good 92.7% |
| Argentineans | 73.4 /100 | #155 | Good 92.7% |
| Immigrants | Spain | 73.0 /100 | #156 | Good 92.7% |
| Immigrants | Eastern Asia | 72.6 /100 | #157 | Good 92.7% |