Jamaican vs German Female Poverty Among 18-24 Year Olds
COMPARE
Jamaican
German
Female Poverty Among 18-24 Year Olds
Female Poverty Among 18-24 Year Olds Comparison
Jamaicans
Germans
19.5%
FEMALE POVERTY AMONG 18-24 YEAR OLDS
92.1/ 100
METRIC RATING
132nd/ 347
METRIC RANK
20.4%
FEMALE POVERTY AMONG 18-24 YEAR OLDS
20.6/ 100
METRIC RATING
199th/ 347
METRIC RANK
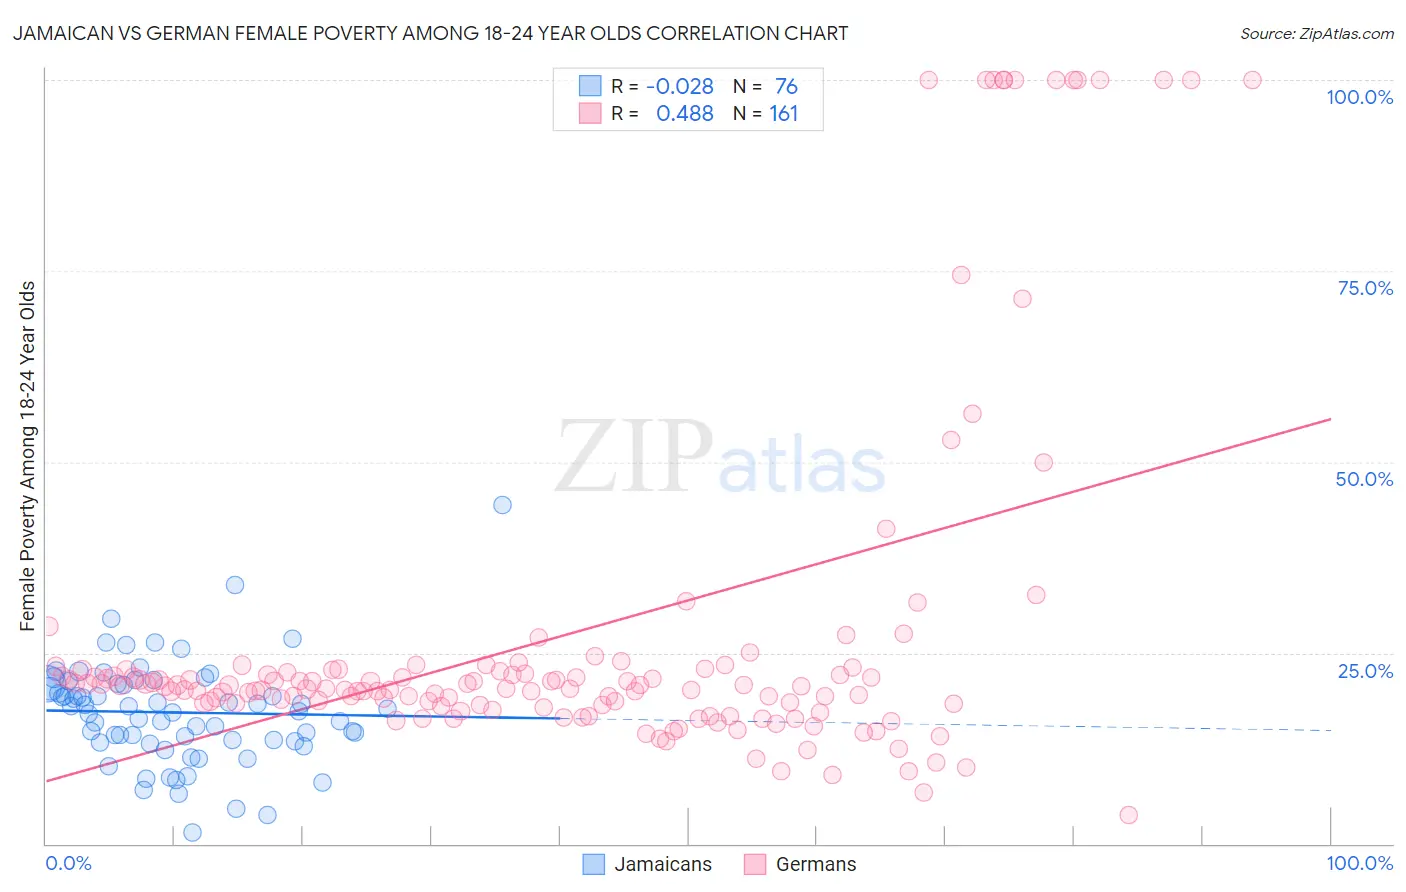
Jamaican vs German Female Poverty Among 18-24 Year Olds Correlation Chart
The statistical analysis conducted on geographies consisting of 360,459,370 people shows no correlation between the proportion of Jamaicans and poverty level among females between the ages 18 and 24 in the United States with a correlation coefficient (R) of -0.028 and weighted average of 19.5%. Similarly, the statistical analysis conducted on geographies consisting of 542,897,180 people shows a moderate positive correlation between the proportion of Germans and poverty level among females between the ages 18 and 24 in the United States with a correlation coefficient (R) of 0.488 and weighted average of 20.4%, a difference of 4.8%.
Female Poverty Among 18-24 Year Olds Correlation Summary
| Measurement | Jamaican | German |
| Minimum | 1.5% | 3.7% |
| Maximum | 44.3% | 100.0% |
| Range | 42.8% | 96.3% |
| Mean | 17.2% | 27.4% |
| Median | 17.5% | 20.6% |
| Interquartile 25% (IQ1) | 13.5% | 18.2% |
| Interquartile 75% (IQ3) | 21.0% | 22.7% |
| Interquartile Range (IQR) | 7.5% | 4.5% |
| Standard Deviation (Sample) | 6.8% | 23.2% |
| Standard Deviation (Population) | 6.7% | 23.2% |
Similar Demographics by Female Poverty Among 18-24 Year Olds
Demographics Similar to Jamaicans by Female Poverty Among 18-24 Year Olds
In terms of female poverty among 18-24 year olds, the demographic groups most similar to Jamaicans are Turkish (19.5%, a difference of 0.0%), Immigrants from North America (19.5%, a difference of 0.010%), Soviet Union (19.5%, a difference of 0.020%), Latvian (19.5%, a difference of 0.10%), and Russian (19.5%, a difference of 0.11%).
| Demographics | Rating | Rank | Female Poverty Among 18-24 Year Olds |
| Immigrants | Panama | 94.0 /100 | #125 | Exceptional 19.4% |
| Immigrants | Russia | 93.7 /100 | #126 | Exceptional 19.4% |
| Cape Verdeans | 93.6 /100 | #127 | Exceptional 19.4% |
| Slovaks | 92.9 /100 | #128 | Exceptional 19.5% |
| Immigrants | England | 92.9 /100 | #129 | Exceptional 19.5% |
| Immigrants | Canada | 92.9 /100 | #130 | Exceptional 19.5% |
| Latvians | 92.7 /100 | #131 | Exceptional 19.5% |
| Jamaicans | 92.1 /100 | #132 | Exceptional 19.5% |
| Turks | 92.1 /100 | #133 | Exceptional 19.5% |
| Immigrants | North America | 92.1 /100 | #134 | Exceptional 19.5% |
| Soviet Union | 92.0 /100 | #135 | Exceptional 19.5% |
| Russians | 91.5 /100 | #136 | Exceptional 19.5% |
| Austrians | 90.7 /100 | #137 | Exceptional 19.5% |
| Immigrants | Morocco | 89.9 /100 | #138 | Excellent 19.6% |
| Indians (Asian) | 88.3 /100 | #139 | Excellent 19.6% |
Demographics Similar to Germans by Female Poverty Among 18-24 Year Olds
In terms of female poverty among 18-24 year olds, the demographic groups most similar to Germans are Immigrants from Spain (20.4%, a difference of 0.010%), Zimbabwean (20.4%, a difference of 0.030%), European (20.4%, a difference of 0.050%), Czech (20.4%, a difference of 0.12%), and Immigrants from Latvia (20.4%, a difference of 0.17%).
| Demographics | Rating | Rank | Female Poverty Among 18-24 Year Olds |
| Immigrants | Israel | 24.4 /100 | #192 | Fair 20.4% |
| Nigerians | 23.4 /100 | #193 | Fair 20.4% |
| Mexican American Indians | 23.2 /100 | #194 | Fair 20.4% |
| Immigrants | Latvia | 23.0 /100 | #195 | Fair 20.4% |
| Czechs | 22.3 /100 | #196 | Fair 20.4% |
| Zimbabweans | 21.0 /100 | #197 | Fair 20.4% |
| Immigrants | Spain | 20.7 /100 | #198 | Fair 20.4% |
| Germans | 20.6 /100 | #199 | Fair 20.4% |
| Europeans | 19.9 /100 | #200 | Poor 20.4% |
| Mexicans | 18.3 /100 | #201 | Poor 20.5% |
| Immigrants | Turkey | 17.7 /100 | #202 | Poor 20.5% |
| Immigrants | Malaysia | 17.2 /100 | #203 | Poor 20.5% |
| Immigrants | Netherlands | 17.0 /100 | #204 | Poor 20.5% |
| English | 16.7 /100 | #205 | Poor 20.5% |
| Hispanics or Latinos | 16.6 /100 | #206 | Poor 20.5% |