Immigrants from Italy vs Immigrants from Colombia Seniors Poverty Over the Age of 65
COMPARE
Immigrants from Italy
Immigrants from Colombia
Seniors Poverty Over the Age of 65
Seniors Poverty Over the Age of 65 Comparison
Immigrants from Italy
Immigrants from Colombia
10.3%
SENIORS POVERTY OVER THE AGE OF 65
92.6/ 100
METRIC RATING
115th/ 347
METRIC RANK
12.9%
SENIORS POVERTY OVER THE AGE OF 65
0.0/ 100
METRIC RATING
275th/ 347
METRIC RANK
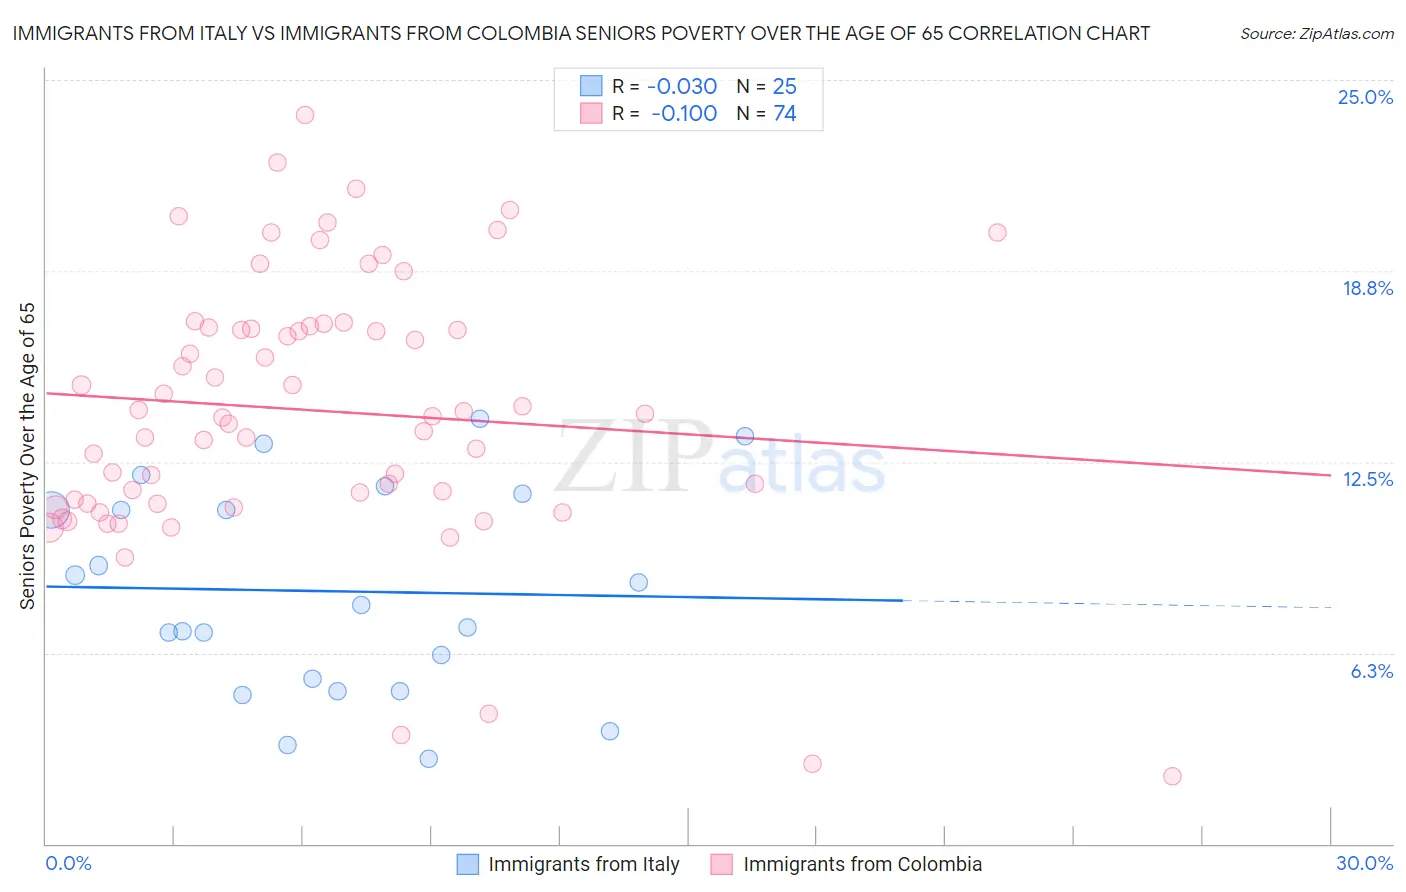
Immigrants from Italy vs Immigrants from Colombia Seniors Poverty Over the Age of 65 Correlation Chart
The statistical analysis conducted on geographies consisting of 323,572,540 people shows no correlation between the proportion of Immigrants from Italy and poverty level among seniors over the age of 65 in the United States with a correlation coefficient (R) of -0.030 and weighted average of 10.3%. Similarly, the statistical analysis conducted on geographies consisting of 377,503,020 people shows a slight negative correlation between the proportion of Immigrants from Colombia and poverty level among seniors over the age of 65 in the United States with a correlation coefficient (R) of -0.100 and weighted average of 12.9%, a difference of 25.0%.
Seniors Poverty Over the Age of 65 Correlation Summary
| Measurement | Immigrants from Italy | Immigrants from Colombia |
| Minimum | 2.8% | 2.2% |
| Maximum | 13.9% | 23.8% |
| Range | 11.1% | 21.6% |
| Mean | 8.3% | 14.2% |
| Median | 7.8% | 14.0% |
| Interquartile 25% (IQ1) | 5.2% | 11.1% |
| Interquartile 75% (IQ3) | 11.2% | 16.9% |
| Interquartile Range (IQR) | 6.0% | 5.8% |
| Standard Deviation (Sample) | 3.3% | 4.4% |
| Standard Deviation (Population) | 3.3% | 4.4% |
Similar Demographics by Seniors Poverty Over the Age of 65
Demographics Similar to Immigrants from Italy by Seniors Poverty Over the Age of 65
In terms of seniors poverty over the age of 65, the demographic groups most similar to Immigrants from Italy are Immigrants from Denmark (10.3%, a difference of 0.040%), Pakistani (10.3%, a difference of 0.15%), Lebanese (10.3%, a difference of 0.21%), Immigrants from Romania (10.3%, a difference of 0.23%), and Immigrants from Korea (10.3%, a difference of 0.27%).
| Demographics | Rating | Rank | Seniors Poverty Over the Age of 65 |
| Immigrants | Croatia | 93.9 /100 | #108 | Exceptional 10.3% |
| Syrians | 93.8 /100 | #109 | Exceptional 10.3% |
| Immigrants | Zimbabwe | 93.5 /100 | #110 | Exceptional 10.3% |
| Immigrants | Belgium | 93.4 /100 | #111 | Exceptional 10.3% |
| Immigrants | Korea | 93.3 /100 | #112 | Exceptional 10.3% |
| Immigrants | Romania | 93.3 /100 | #113 | Exceptional 10.3% |
| Immigrants | Denmark | 92.7 /100 | #114 | Exceptional 10.3% |
| Immigrants | Italy | 92.6 /100 | #115 | Exceptional 10.3% |
| Pakistanis | 92.2 /100 | #116 | Exceptional 10.3% |
| Lebanese | 92.0 /100 | #117 | Exceptional 10.3% |
| Okinawans | 91.7 /100 | #118 | Exceptional 10.4% |
| Immigrants | Western Europe | 91.1 /100 | #119 | Exceptional 10.4% |
| Immigrants | Bosnia and Herzegovina | 90.8 /100 | #120 | Exceptional 10.4% |
| Immigrants | Iraq | 90.7 /100 | #121 | Exceptional 10.4% |
| Immigrants | Moldova | 90.7 /100 | #122 | Exceptional 10.4% |
Demographics Similar to Immigrants from Colombia by Seniors Poverty Over the Age of 65
In terms of seniors poverty over the age of 65, the demographic groups most similar to Immigrants from Colombia are Immigrants from the Azores (12.9%, a difference of 0.22%), Paiute (12.9%, a difference of 0.32%), Salvadoran (12.8%, a difference of 0.67%), Kiowa (12.8%, a difference of 0.92%), and Immigrants from Uruguay (12.8%, a difference of 1.0%).
| Demographics | Rating | Rank | Seniors Poverty Over the Age of 65 |
| Immigrants | Somalia | 0.1 /100 | #268 | Tragic 12.6% |
| Immigrants | Venezuela | 0.1 /100 | #269 | Tragic 12.7% |
| Immigrants | South America | 0.1 /100 | #270 | Tragic 12.7% |
| Immigrants | Ghana | 0.1 /100 | #271 | Tragic 12.8% |
| Immigrants | Uruguay | 0.1 /100 | #272 | Tragic 12.8% |
| Kiowa | 0.0 /100 | #273 | Tragic 12.8% |
| Salvadorans | 0.0 /100 | #274 | Tragic 12.8% |
| Immigrants | Colombia | 0.0 /100 | #275 | Tragic 12.9% |
| Immigrants | Azores | 0.0 /100 | #276 | Tragic 12.9% |
| Paiute | 0.0 /100 | #277 | Tragic 12.9% |
| Immigrants | Bahamas | 0.0 /100 | #278 | Tragic 13.0% |
| Mexicans | 0.0 /100 | #279 | Tragic 13.1% |
| Yuman | 0.0 /100 | #280 | Tragic 13.1% |
| Immigrants | El Salvador | 0.0 /100 | #281 | Tragic 13.1% |
| Senegalese | 0.0 /100 | #282 | Tragic 13.3% |