Immigrants from Italy vs Seminole Female Poverty Among 25-34 Year Olds
COMPARE
Immigrants from Italy
Seminole
Female Poverty Among 25-34 Year Olds
Female Poverty Among 25-34 Year Olds Comparison
Immigrants from Italy
Seminole
12.3%
FEMALE POVERTY AMONG 25-34 YEAR OLDS
98.8/ 100
METRIC RATING
77th/ 347
METRIC RANK
18.3%
FEMALE POVERTY AMONG 25-34 YEAR OLDS
0.0/ 100
METRIC RATING
323rd/ 347
METRIC RANK
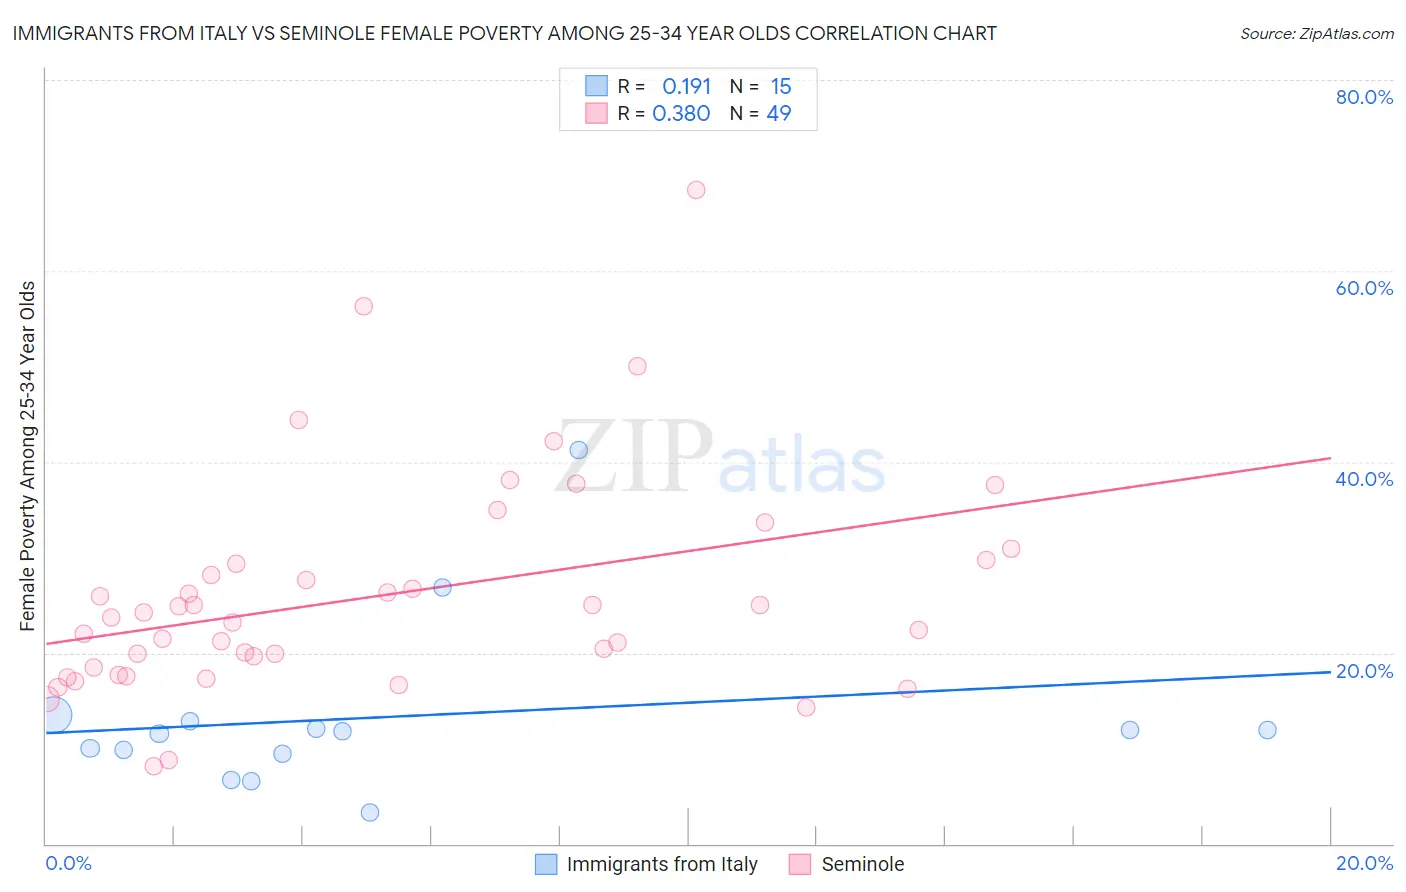
Immigrants from Italy vs Seminole Female Poverty Among 25-34 Year Olds Correlation Chart
The statistical analysis conducted on geographies consisting of 318,337,558 people shows a poor positive correlation between the proportion of Immigrants from Italy and poverty level among females between the ages 25 and 34 in the United States with a correlation coefficient (R) of 0.191 and weighted average of 12.3%. Similarly, the statistical analysis conducted on geographies consisting of 117,900,324 people shows a mild positive correlation between the proportion of Seminole and poverty level among females between the ages 25 and 34 in the United States with a correlation coefficient (R) of 0.380 and weighted average of 18.3%, a difference of 48.5%.
Female Poverty Among 25-34 Year Olds Correlation Summary
| Measurement | Immigrants from Italy | Seminole |
| Minimum | 3.2% | 8.1% |
| Maximum | 41.3% | 68.4% |
| Range | 38.1% | 60.3% |
| Mean | 13.3% | 26.0% |
| Median | 11.8% | 23.7% |
| Interquartile 25% (IQ1) | 9.4% | 18.1% |
| Interquartile 75% (IQ3) | 12.9% | 29.5% |
| Interquartile Range (IQR) | 3.5% | 11.5% |
| Standard Deviation (Sample) | 9.3% | 11.5% |
| Standard Deviation (Population) | 9.0% | 11.4% |
Similar Demographics by Female Poverty Among 25-34 Year Olds
Demographics Similar to Immigrants from Italy by Female Poverty Among 25-34 Year Olds
In terms of female poverty among 25-34 year olds, the demographic groups most similar to Immigrants from Italy are Greek (12.3%, a difference of 0.16%), Estonian (12.3%, a difference of 0.22%), Immigrants from Ukraine (12.3%, a difference of 0.23%), Immigrants from Sweden (12.3%, a difference of 0.27%), and Immigrants from Vietnam (12.3%, a difference of 0.30%).
| Demographics | Rating | Rank | Female Poverty Among 25-34 Year Olds |
| Immigrants | Belgium | 99.1 /100 | #70 | Exceptional 12.2% |
| Immigrants | Scotland | 99.1 /100 | #71 | Exceptional 12.2% |
| Lithuanians | 99.1 /100 | #72 | Exceptional 12.2% |
| Immigrants | Vietnam | 98.9 /100 | #73 | Exceptional 12.3% |
| Immigrants | Sweden | 98.9 /100 | #74 | Exceptional 12.3% |
| Estonians | 98.9 /100 | #75 | Exceptional 12.3% |
| Greeks | 98.9 /100 | #76 | Exceptional 12.3% |
| Immigrants | Italy | 98.8 /100 | #77 | Exceptional 12.3% |
| Immigrants | Ukraine | 98.6 /100 | #78 | Exceptional 12.3% |
| Immigrants | Jordan | 98.5 /100 | #79 | Exceptional 12.4% |
| Immigrants | Malaysia | 98.3 /100 | #80 | Exceptional 12.4% |
| Immigrants | Kazakhstan | 98.1 /100 | #81 | Exceptional 12.4% |
| Ethiopians | 98.0 /100 | #82 | Exceptional 12.4% |
| Albanians | 97.7 /100 | #83 | Exceptional 12.5% |
| Immigrants | Latvia | 97.7 /100 | #84 | Exceptional 12.5% |
Demographics Similar to Seminole by Female Poverty Among 25-34 Year Olds
In terms of female poverty among 25-34 year olds, the demographic groups most similar to Seminole are Central American Indian (18.2%, a difference of 0.32%), Dutch West Indian (18.4%, a difference of 0.95%), Choctaw (18.1%, a difference of 1.2%), Chippewa (18.0%, a difference of 1.4%), and Inupiat (18.5%, a difference of 1.5%).
| Demographics | Rating | Rank | Female Poverty Among 25-34 Year Olds |
| Dominicans | 0.0 /100 | #316 | Tragic 17.6% |
| Arapaho | 0.0 /100 | #317 | Tragic 17.8% |
| Ute | 0.0 /100 | #318 | Tragic 17.9% |
| Menominee | 0.0 /100 | #319 | Tragic 18.0% |
| Chippewa | 0.0 /100 | #320 | Tragic 18.0% |
| Choctaw | 0.0 /100 | #321 | Tragic 18.1% |
| Central American Indians | 0.0 /100 | #322 | Tragic 18.2% |
| Seminole | 0.0 /100 | #323 | Tragic 18.3% |
| Dutch West Indians | 0.0 /100 | #324 | Tragic 18.4% |
| Inupiat | 0.0 /100 | #325 | Tragic 18.5% |
| Blacks/African Americans | 0.0 /100 | #326 | Tragic 18.9% |
| Cheyenne | 0.0 /100 | #327 | Tragic 19.1% |
| Alaskan Athabascans | 0.0 /100 | #328 | Tragic 19.1% |
| Creek | 0.0 /100 | #329 | Tragic 19.2% |
| Paiute | 0.0 /100 | #330 | Tragic 19.6% |