Immigrants from India vs Soviet Union Child Poverty Among Girls Under 16
COMPARE
Immigrants from India
Soviet Union
Child Poverty Among Girls Under 16
Child Poverty Among Girls Under 16 Comparison
Immigrants from India
Soviet Union
11.0%
CHILD POVERTY AMONG GIRLS UNDER 16
100.0/ 100
METRIC RATING
1st/ 347
METRIC RANK
14.8%
CHILD POVERTY AMONG GIRLS UNDER 16
97.3/ 100
METRIC RATING
84th/ 347
METRIC RANK
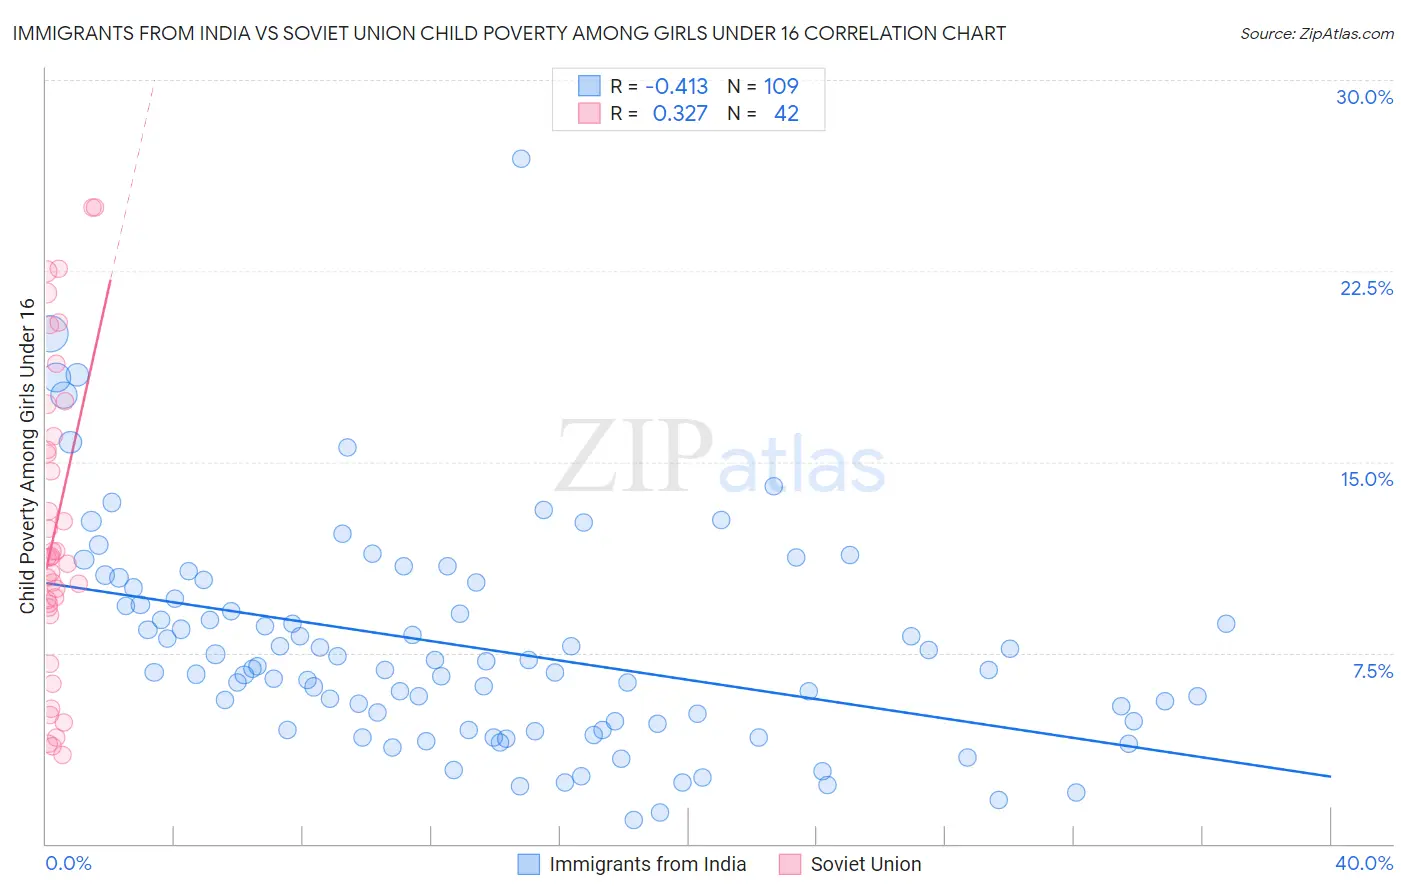
Immigrants from India vs Soviet Union Child Poverty Among Girls Under 16 Correlation Chart
The statistical analysis conducted on geographies consisting of 424,282,439 people shows a moderate negative correlation between the proportion of Immigrants from India and poverty level among girls under the age of 16 in the United States with a correlation coefficient (R) of -0.413 and weighted average of 11.0%. Similarly, the statistical analysis conducted on geographies consisting of 43,333,279 people shows a mild positive correlation between the proportion of Soviet Union and poverty level among girls under the age of 16 in the United States with a correlation coefficient (R) of 0.327 and weighted average of 14.8%, a difference of 34.0%.
Child Poverty Among Girls Under 16 Correlation Summary
| Measurement | Immigrants from India | Soviet Union |
| Minimum | 0.96% | 3.5% |
| Maximum | 26.9% | 25.0% |
| Range | 26.0% | 21.5% |
| Mean | 7.7% | 12.4% |
| Median | 6.9% | 11.2% |
| Interquartile 25% (IQ1) | 4.6% | 9.3% |
| Interquartile 75% (IQ3) | 9.8% | 16.0% |
| Interquartile Range (IQR) | 5.2% | 6.7% |
| Standard Deviation (Sample) | 4.3% | 6.0% |
| Standard Deviation (Population) | 4.3% | 5.9% |
Similar Demographics by Child Poverty Among Girls Under 16
Demographics Similar to Immigrants from India by Child Poverty Among Girls Under 16
In terms of child poverty among girls under 16, the demographic groups most similar to Immigrants from India are Immigrants from Taiwan (11.3%, a difference of 2.6%), Filipino (11.4%, a difference of 3.5%), Tsimshian (11.5%, a difference of 4.1%), Thai (11.8%, a difference of 7.2%), and Immigrants from Hong Kong (12.3%, a difference of 11.8%).
| Demographics | Rating | Rank | Child Poverty Among Girls Under 16 |
| Immigrants | India | 100.0 /100 | #1 | Exceptional 11.0% |
| Immigrants | Taiwan | 100.0 /100 | #2 | Exceptional 11.3% |
| Filipinos | 100.0 /100 | #3 | Exceptional 11.4% |
| Tsimshian | 100.0 /100 | #4 | Exceptional 11.5% |
| Thais | 100.0 /100 | #5 | Exceptional 11.8% |
| Immigrants | Hong Kong | 100.0 /100 | #6 | Exceptional 12.3% |
| Chinese | 100.0 /100 | #7 | Exceptional 12.3% |
| Iranians | 100.0 /100 | #8 | Exceptional 12.4% |
| Immigrants | Singapore | 100.0 /100 | #9 | Exceptional 12.5% |
| Immigrants | Iran | 100.0 /100 | #10 | Exceptional 12.6% |
| Immigrants | South Central Asia | 100.0 /100 | #11 | Exceptional 12.7% |
| Bhutanese | 100.0 /100 | #12 | Exceptional 12.7% |
| Immigrants | Ireland | 99.9 /100 | #13 | Exceptional 12.9% |
| Burmese | 99.9 /100 | #14 | Exceptional 13.0% |
| Okinawans | 99.9 /100 | #15 | Exceptional 13.0% |
Demographics Similar to Soviet Union by Child Poverty Among Girls Under 16
In terms of child poverty among girls under 16, the demographic groups most similar to Soviet Union are Immigrants from Italy (14.8%, a difference of 0.070%), Swiss (14.8%, a difference of 0.11%), Australian (14.8%, a difference of 0.15%), Finnish (14.8%, a difference of 0.18%), and Immigrants from Canada (14.8%, a difference of 0.24%).
| Demographics | Rating | Rank | Child Poverty Among Girls Under 16 |
| Tlingit-Haida | 97.9 /100 | #77 | Exceptional 14.7% |
| Argentineans | 97.9 /100 | #78 | Exceptional 14.7% |
| Immigrants | Turkey | 97.9 /100 | #79 | Exceptional 14.7% |
| Egyptians | 97.9 /100 | #80 | Exceptional 14.7% |
| Ukrainians | 97.7 /100 | #81 | Exceptional 14.7% |
| Macedonians | 97.6 /100 | #82 | Exceptional 14.7% |
| Immigrants | Italy | 97.4 /100 | #83 | Exceptional 14.8% |
| Soviet Union | 97.3 /100 | #84 | Exceptional 14.8% |
| Swiss | 97.2 /100 | #85 | Exceptional 14.8% |
| Australians | 97.2 /100 | #86 | Exceptional 14.8% |
| Finns | 97.2 /100 | #87 | Exceptional 14.8% |
| Immigrants | Canada | 97.1 /100 | #88 | Exceptional 14.8% |
| Jordanians | 97.1 /100 | #89 | Exceptional 14.8% |
| Northern Europeans | 97.0 /100 | #90 | Exceptional 14.8% |
| Immigrants | Belarus | 97.0 /100 | #91 | Exceptional 14.8% |