Immigrants from Hungary vs Yuman Child Poverty Among Boys Under 16
COMPARE
Immigrants from Hungary
Yuman
Child Poverty Among Boys Under 16
Child Poverty Among Boys Under 16 Comparison
Immigrants from Hungary
Yuman
15.7%
CHILD POVERTY AMONG BOYS UNDER 16
84.1/ 100
METRIC RATING
142nd/ 347
METRIC RANK
30.6%
CHILD POVERTY AMONG BOYS UNDER 16
0.0/ 100
METRIC RATING
344th/ 347
METRIC RANK
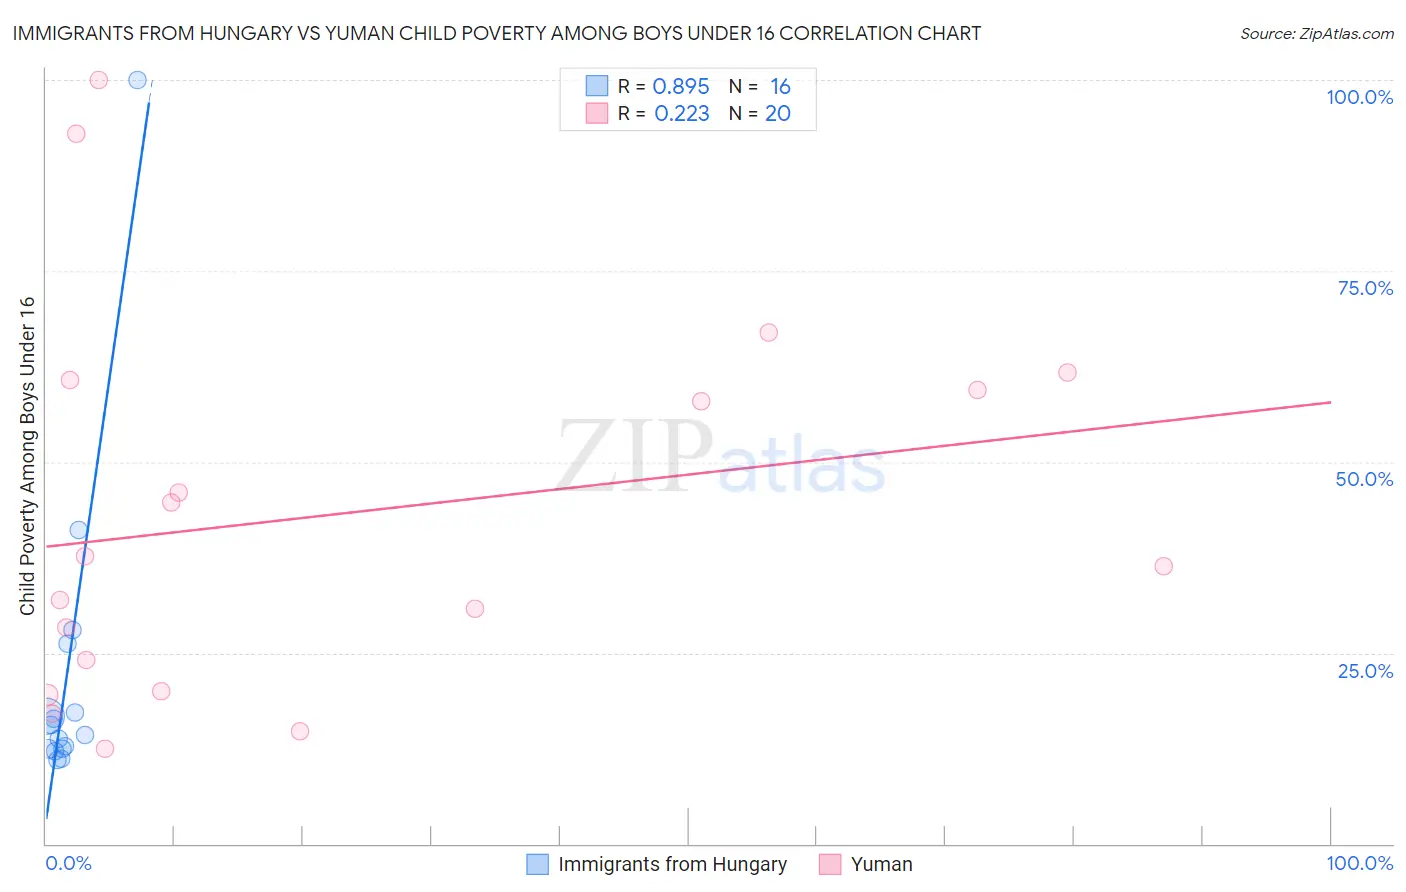
Immigrants from Hungary vs Yuman Child Poverty Among Boys Under 16 Correlation Chart
The statistical analysis conducted on geographies consisting of 193,561,492 people shows a very strong positive correlation between the proportion of Immigrants from Hungary and poverty level among boys under the age of 16 in the United States with a correlation coefficient (R) of 0.895 and weighted average of 15.7%. Similarly, the statistical analysis conducted on geographies consisting of 40,605,786 people shows a weak positive correlation between the proportion of Yuman and poverty level among boys under the age of 16 in the United States with a correlation coefficient (R) of 0.223 and weighted average of 30.6%, a difference of 95.5%.
Child Poverty Among Boys Under 16 Correlation Summary
| Measurement | Immigrants from Hungary | Yuman |
| Minimum | 10.9% | 12.5% |
| Maximum | 100.0% | 100.0% |
| Range | 89.1% | 87.5% |
| Mean | 22.5% | 43.2% |
| Median | 14.9% | 37.0% |
| Interquartile 25% (IQ1) | 12.4% | 22.0% |
| Interquartile 75% (IQ3) | 21.6% | 60.0% |
| Interquartile Range (IQR) | 9.2% | 38.0% |
| Standard Deviation (Sample) | 22.1% | 25.0% |
| Standard Deviation (Population) | 21.4% | 24.4% |
Similar Demographics by Child Poverty Among Boys Under 16
Demographics Similar to Immigrants from Hungary by Child Poverty Among Boys Under 16
In terms of child poverty among boys under 16, the demographic groups most similar to Immigrants from Hungary are Slavic (15.7%, a difference of 0.090%), Immigrants from Fiji (15.7%, a difference of 0.11%), Immigrants from Peru (15.7%, a difference of 0.13%), Samoan (15.7%, a difference of 0.18%), and New Zealander (15.7%, a difference of 0.34%).
| Demographics | Rating | Rank | Child Poverty Among Boys Under 16 |
| Portuguese | 87.5 /100 | #135 | Excellent 15.5% |
| Icelanders | 87.5 /100 | #136 | Excellent 15.5% |
| Immigrants | Spain | 87.1 /100 | #137 | Excellent 15.6% |
| Immigrants | Southern Europe | 86.5 /100 | #138 | Excellent 15.6% |
| Albanians | 86.5 /100 | #139 | Excellent 15.6% |
| Immigrants | Kuwait | 85.6 /100 | #140 | Excellent 15.6% |
| Slavs | 84.5 /100 | #141 | Excellent 15.7% |
| Immigrants | Hungary | 84.1 /100 | #142 | Excellent 15.7% |
| Immigrants | Fiji | 83.6 /100 | #143 | Excellent 15.7% |
| Immigrants | Peru | 83.5 /100 | #144 | Excellent 15.7% |
| Samoans | 83.2 /100 | #145 | Excellent 15.7% |
| New Zealanders | 82.4 /100 | #146 | Excellent 15.7% |
| Venezuelans | 82.1 /100 | #147 | Excellent 15.7% |
| Brazilians | 81.0 /100 | #148 | Excellent 15.8% |
| Slovaks | 80.3 /100 | #149 | Excellent 15.8% |
Demographics Similar to Yuman by Child Poverty Among Boys Under 16
In terms of child poverty among boys under 16, the demographic groups most similar to Yuman are Navajo (30.3%, a difference of 1.2%), Tohono O'odham (31.6%, a difference of 3.0%), Pima (29.7%, a difference of 3.0%), Lumbee (31.9%, a difference of 4.2%), and Immigrants from Yemen (28.9%, a difference of 6.2%).
| Demographics | Rating | Rank | Child Poverty Among Boys Under 16 |
| Apache | 0.0 /100 | #333 | Tragic 24.5% |
| Blacks/African Americans | 0.0 /100 | #334 | Tragic 24.5% |
| Yup'ik | 0.0 /100 | #335 | Tragic 24.7% |
| Sioux | 0.0 /100 | #336 | Tragic 25.3% |
| Cheyenne | 0.0 /100 | #337 | Tragic 25.8% |
| Hopi | 0.0 /100 | #338 | Tragic 25.9% |
| Houma | 0.0 /100 | #339 | Tragic 26.2% |
| Crow | 0.0 /100 | #340 | Tragic 26.3% |
| Immigrants | Yemen | 0.0 /100 | #341 | Tragic 28.9% |
| Pima | 0.0 /100 | #342 | Tragic 29.7% |
| Navajo | 0.0 /100 | #343 | Tragic 30.3% |
| Yuman | 0.0 /100 | #344 | Tragic 30.6% |
| Tohono O'odham | 0.0 /100 | #345 | Tragic 31.6% |
| Lumbee | 0.0 /100 | #346 | Tragic 31.9% |
| Puerto Ricans | 0.0 /100 | #347 | Tragic 32.8% |