Guatemalan vs Yuman Child Poverty Among Boys Under 16
COMPARE
Guatemalan
Yuman
Child Poverty Among Boys Under 16
Child Poverty Among Boys Under 16 Comparison
Guatemalans
Yuman
21.1%
CHILD POVERTY AMONG BOYS UNDER 16
0.0/ 100
METRIC RATING
301st/ 347
METRIC RANK
30.6%
CHILD POVERTY AMONG BOYS UNDER 16
0.0/ 100
METRIC RATING
344th/ 347
METRIC RANK
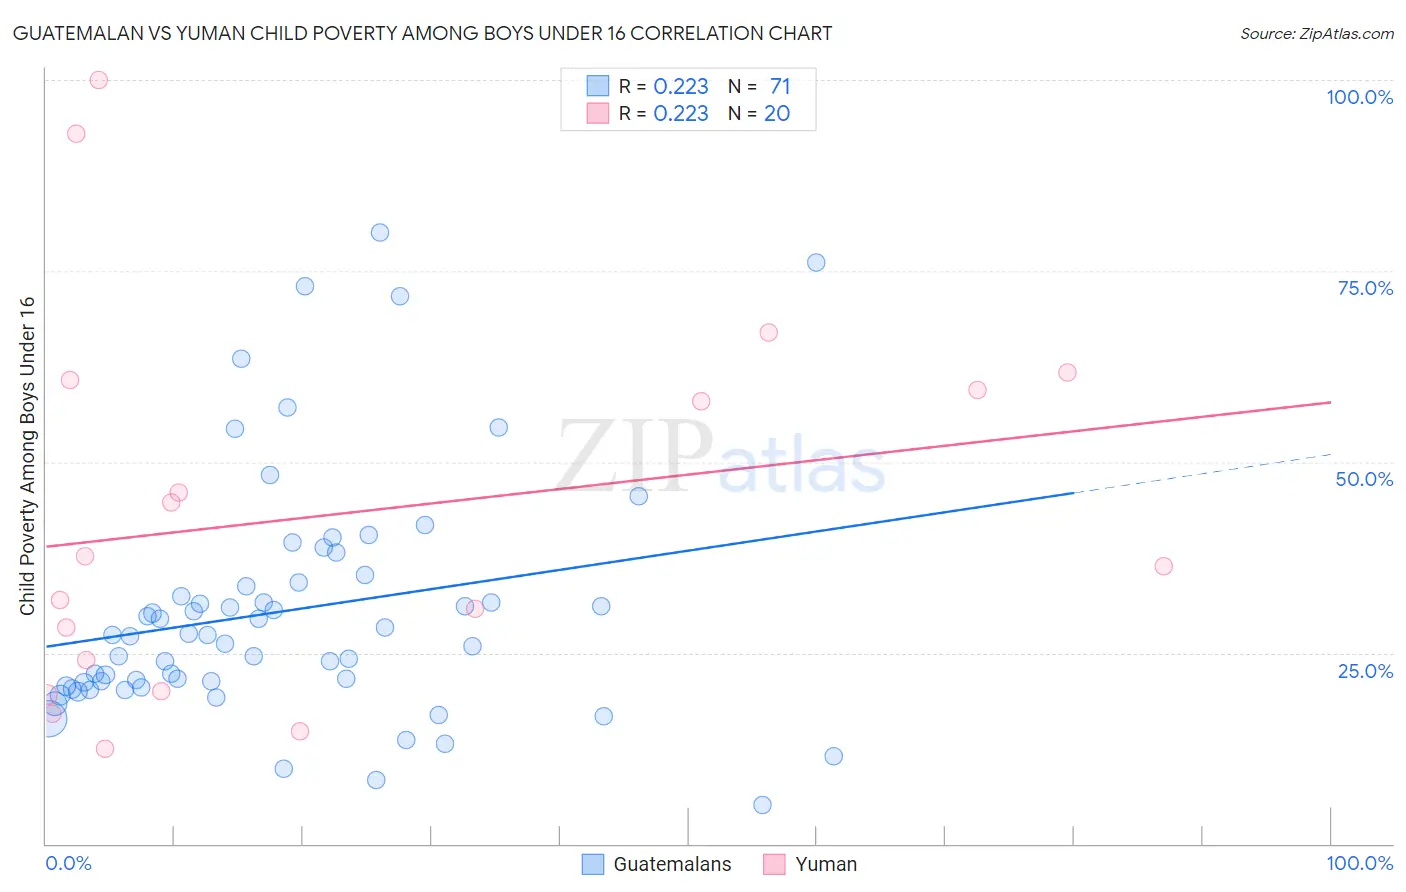
Guatemalan vs Yuman Child Poverty Among Boys Under 16 Correlation Chart
The statistical analysis conducted on geographies consisting of 404,337,811 people shows a weak positive correlation between the proportion of Guatemalans and poverty level among boys under the age of 16 in the United States with a correlation coefficient (R) of 0.223 and weighted average of 21.1%. Similarly, the statistical analysis conducted on geographies consisting of 40,605,786 people shows a weak positive correlation between the proportion of Yuman and poverty level among boys under the age of 16 in the United States with a correlation coefficient (R) of 0.223 and weighted average of 30.6%, a difference of 44.9%.
Child Poverty Among Boys Under 16 Correlation Summary
| Measurement | Guatemalan | Yuman |
| Minimum | 5.0% | 12.5% |
| Maximum | 80.0% | 100.0% |
| Range | 75.0% | 87.5% |
| Mean | 30.4% | 43.2% |
| Median | 27.3% | 37.0% |
| Interquartile 25% (IQ1) | 20.7% | 22.0% |
| Interquartile 75% (IQ3) | 34.3% | 60.0% |
| Interquartile Range (IQR) | 13.6% | 38.0% |
| Standard Deviation (Sample) | 15.7% | 25.0% |
| Standard Deviation (Population) | 15.6% | 24.4% |
Similar Demographics by Child Poverty Among Boys Under 16
Demographics Similar to Guatemalans by Child Poverty Among Boys Under 16
In terms of child poverty among boys under 16, the demographic groups most similar to Guatemalans are Somali (21.1%, a difference of 0.0%), Haitian (21.0%, a difference of 0.54%), Immigrants from Haiti (21.3%, a difference of 0.54%), Immigrants from Caribbean (21.0%, a difference of 0.59%), and Immigrants from Central America (21.3%, a difference of 0.60%).
| Demographics | Rating | Rank | Child Poverty Among Boys Under 16 |
| Immigrants | Bahamas | 0.0 /100 | #294 | Tragic 20.7% |
| Mexicans | 0.0 /100 | #295 | Tragic 20.7% |
| Indonesians | 0.0 /100 | #296 | Tragic 20.8% |
| Hispanics or Latinos | 0.0 /100 | #297 | Tragic 20.9% |
| Chippewa | 0.0 /100 | #298 | Tragic 21.0% |
| Immigrants | Caribbean | 0.0 /100 | #299 | Tragic 21.0% |
| Haitians | 0.0 /100 | #300 | Tragic 21.0% |
| Guatemalans | 0.0 /100 | #301 | Tragic 21.1% |
| Somalis | 0.0 /100 | #302 | Tragic 21.1% |
| Immigrants | Haiti | 0.0 /100 | #303 | Tragic 21.3% |
| Immigrants | Central America | 0.0 /100 | #304 | Tragic 21.3% |
| Kiowa | 0.0 /100 | #305 | Tragic 21.3% |
| Immigrants | Grenada | 0.0 /100 | #306 | Tragic 21.3% |
| Choctaw | 0.0 /100 | #307 | Tragic 21.3% |
| Immigrants | Mexico | 0.0 /100 | #308 | Tragic 21.5% |
Demographics Similar to Yuman by Child Poverty Among Boys Under 16
In terms of child poverty among boys under 16, the demographic groups most similar to Yuman are Navajo (30.3%, a difference of 1.2%), Tohono O'odham (31.6%, a difference of 3.0%), Pima (29.7%, a difference of 3.0%), Lumbee (31.9%, a difference of 4.2%), and Immigrants from Yemen (28.9%, a difference of 6.2%).
| Demographics | Rating | Rank | Child Poverty Among Boys Under 16 |
| Apache | 0.0 /100 | #333 | Tragic 24.5% |
| Blacks/African Americans | 0.0 /100 | #334 | Tragic 24.5% |
| Yup'ik | 0.0 /100 | #335 | Tragic 24.7% |
| Sioux | 0.0 /100 | #336 | Tragic 25.3% |
| Cheyenne | 0.0 /100 | #337 | Tragic 25.8% |
| Hopi | 0.0 /100 | #338 | Tragic 25.9% |
| Houma | 0.0 /100 | #339 | Tragic 26.2% |
| Crow | 0.0 /100 | #340 | Tragic 26.3% |
| Immigrants | Yemen | 0.0 /100 | #341 | Tragic 28.9% |
| Pima | 0.0 /100 | #342 | Tragic 29.7% |
| Navajo | 0.0 /100 | #343 | Tragic 30.3% |
| Yuman | 0.0 /100 | #344 | Tragic 30.6% |
| Tohono O'odham | 0.0 /100 | #345 | Tragic 31.6% |
| Lumbee | 0.0 /100 | #346 | Tragic 31.9% |
| Puerto Ricans | 0.0 /100 | #347 | Tragic 32.8% |