Slovene vs Nonimmigrants Seniors Poverty Over the Age of 75
COMPARE
Slovene
Nonimmigrants
Seniors Poverty Over the Age of 75
Seniors Poverty Over the Age of 75 Comparison
Slovenes
Nonimmigrants
10.6%
SENIORS POVERTY OVER THE AGE OF 75
99.9/ 100
METRIC RATING
21st/ 347
METRIC RANK
12.2%
SENIORS POVERTY OVER THE AGE OF 75
46.8/ 100
METRIC RATING
178th/ 347
METRIC RANK
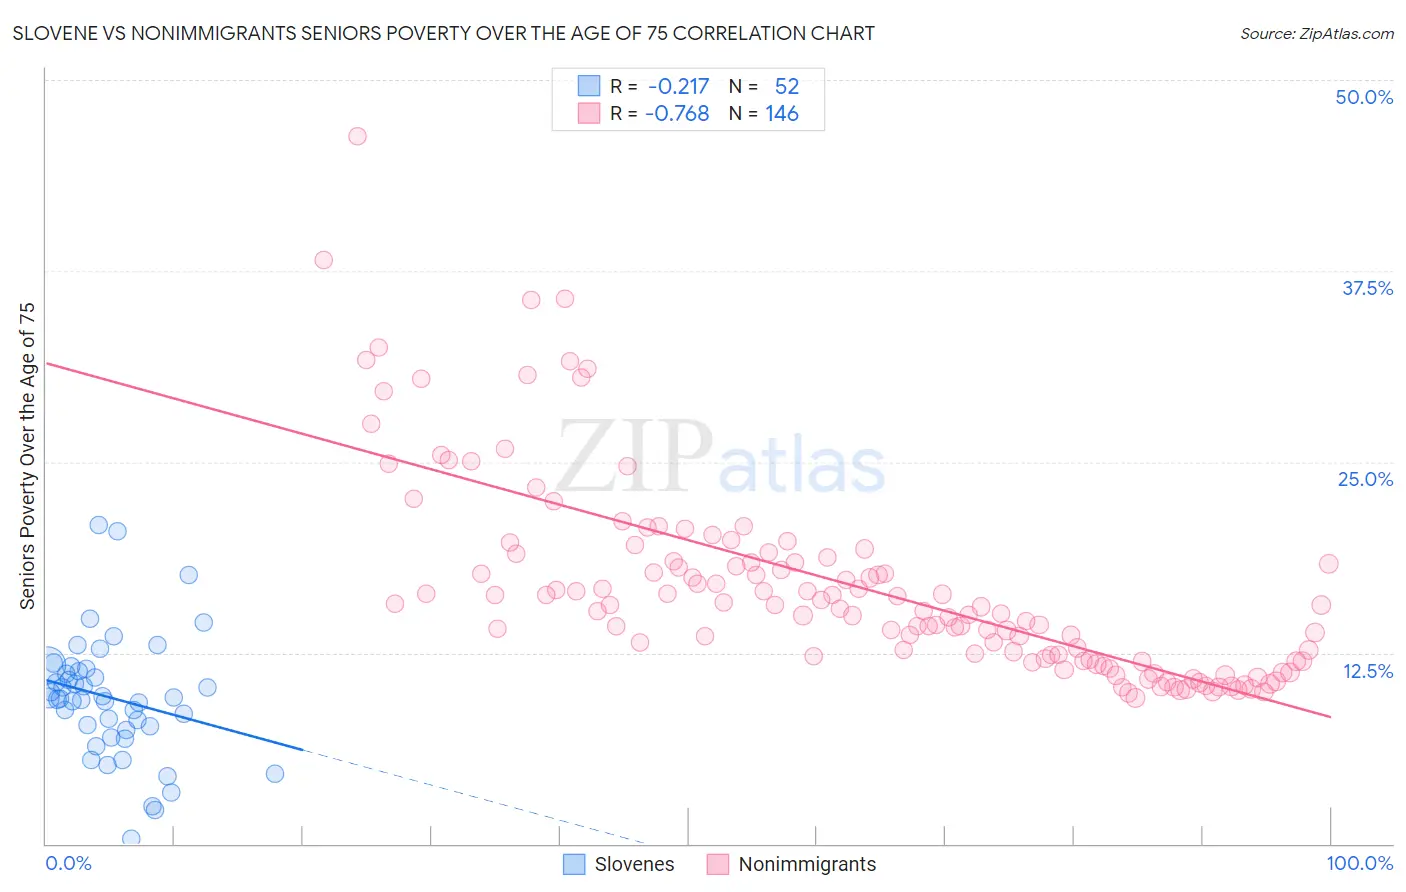
Slovene vs Nonimmigrants Seniors Poverty Over the Age of 75 Correlation Chart
The statistical analysis conducted on geographies consisting of 259,031,595 people shows a weak negative correlation between the proportion of Slovenes and poverty level among seniors over the age of 75 in the United States with a correlation coefficient (R) of -0.217 and weighted average of 10.6%. Similarly, the statistical analysis conducted on geographies consisting of 564,663,130 people shows a strong negative correlation between the proportion of Nonimmigrants and poverty level among seniors over the age of 75 in the United States with a correlation coefficient (R) of -0.768 and weighted average of 12.2%, a difference of 15.8%.
Seniors Poverty Over the Age of 75 Correlation Summary
| Measurement | Slovene | Nonimmigrants |
| Minimum | 0.36% | 9.5% |
| Maximum | 20.8% | 46.3% |
| Range | 20.5% | 36.8% |
| Mean | 9.6% | 16.8% |
| Median | 9.5% | 15.5% |
| Interquartile 25% (IQ1) | 7.6% | 12.0% |
| Interquartile 75% (IQ3) | 11.4% | 18.5% |
| Interquartile Range (IQR) | 3.8% | 6.5% |
| Standard Deviation (Sample) | 4.0% | 6.5% |
| Standard Deviation (Population) | 4.0% | 6.5% |
Similar Demographics by Seniors Poverty Over the Age of 75
Demographics Similar to Slovenes by Seniors Poverty Over the Age of 75
In terms of seniors poverty over the age of 75, the demographic groups most similar to Slovenes are Czech (10.5%, a difference of 0.040%), Immigrants from Scotland (10.5%, a difference of 0.060%), Welsh (10.5%, a difference of 0.090%), Slovak (10.5%, a difference of 0.10%), and Bhutanese (10.6%, a difference of 0.26%).
| Demographics | Rating | Rank | Seniors Poverty Over the Age of 75 |
| Scottish | 99.9 /100 | #14 | Exceptional 10.5% |
| Europeans | 99.9 /100 | #15 | Exceptional 10.5% |
| Dutch | 99.9 /100 | #16 | Exceptional 10.5% |
| Slovaks | 99.9 /100 | #17 | Exceptional 10.5% |
| Welsh | 99.9 /100 | #18 | Exceptional 10.5% |
| Immigrants | Scotland | 99.9 /100 | #19 | Exceptional 10.5% |
| Czechs | 99.9 /100 | #20 | Exceptional 10.5% |
| Slovenes | 99.9 /100 | #21 | Exceptional 10.6% |
| Bhutanese | 99.8 /100 | #22 | Exceptional 10.6% |
| Lithuanians | 99.8 /100 | #23 | Exceptional 10.6% |
| Poles | 99.8 /100 | #24 | Exceptional 10.6% |
| Menominee | 99.8 /100 | #25 | Exceptional 10.6% |
| Bulgarians | 99.8 /100 | #26 | Exceptional 10.7% |
| Northern Europeans | 99.8 /100 | #27 | Exceptional 10.7% |
| Irish | 99.8 /100 | #28 | Exceptional 10.7% |
Demographics Similar to Nonimmigrants by Seniors Poverty Over the Age of 75
In terms of seniors poverty over the age of 75, the demographic groups most similar to Nonimmigrants are Immigrants from Asia (12.2%, a difference of 0.080%), Immigrants from Iran (12.2%, a difference of 0.10%), Mongolian (12.2%, a difference of 0.11%), Immigrants from Saudi Arabia (12.2%, a difference of 0.21%), and Immigrants from South Eastern Asia (12.2%, a difference of 0.21%).
| Demographics | Rating | Rank | Seniors Poverty Over the Age of 75 |
| Spaniards | 51.6 /100 | #171 | Average 12.2% |
| Immigrants | Fiji | 51.5 /100 | #172 | Average 12.2% |
| Arabs | 50.5 /100 | #173 | Average 12.2% |
| Immigrants | Europe | 50.0 /100 | #174 | Average 12.2% |
| Immigrants | Saudi Arabia | 49.5 /100 | #175 | Average 12.2% |
| Immigrants | Iran | 48.1 /100 | #176 | Average 12.2% |
| Immigrants | Asia | 47.8 /100 | #177 | Average 12.2% |
| Immigrants | Nonimmigrants | 46.8 /100 | #178 | Average 12.2% |
| Mongolians | 45.5 /100 | #179 | Average 12.2% |
| Immigrants | South Eastern Asia | 44.3 /100 | #180 | Average 12.2% |
| Immigrants | Australia | 44.2 /100 | #181 | Average 12.2% |
| German Russians | 41.4 /100 | #182 | Average 12.3% |
| Laotians | 38.2 /100 | #183 | Fair 12.3% |
| Kiowa | 36.0 /100 | #184 | Fair 12.3% |
| Immigrants | Malaysia | 35.8 /100 | #185 | Fair 12.3% |