Immigrants from Hungary vs Finnish Single Father Poverty
COMPARE
Immigrants from Hungary
Finnish
Single Father Poverty
Single Father Poverty Comparison
Immigrants from Hungary
Finns
16.1%
SINGLE FATHER POVERTY
78.3/ 100
METRIC RATING
146th/ 347
METRIC RANK
16.9%
SINGLE FATHER POVERTY
2.6/ 100
METRIC RATING
240th/ 347
METRIC RANK
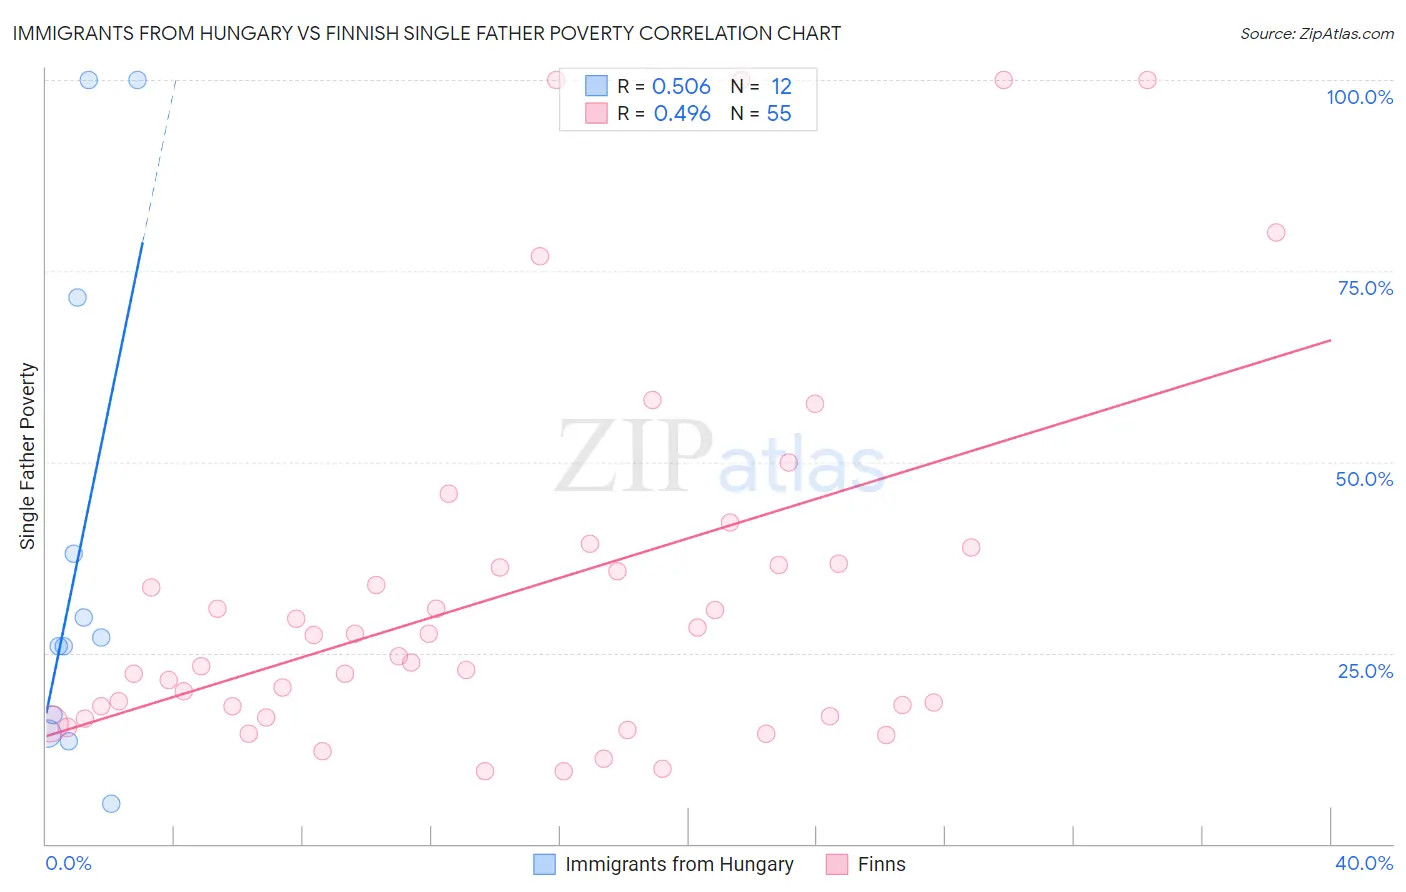
Immigrants from Hungary vs Finnish Single Father Poverty Correlation Chart
The statistical analysis conducted on geographies consisting of 163,698,265 people shows a substantial positive correlation between the proportion of Immigrants from Hungary and poverty level among single fathers in the United States with a correlation coefficient (R) of 0.506 and weighted average of 16.1%. Similarly, the statistical analysis conducted on geographies consisting of 310,078,024 people shows a moderate positive correlation between the proportion of Finns and poverty level among single fathers in the United States with a correlation coefficient (R) of 0.496 and weighted average of 16.9%, a difference of 5.5%.
Single Father Poverty Correlation Summary
| Measurement | Immigrants from Hungary | Finnish |
| Minimum | 5.2% | 9.5% |
| Maximum | 100.0% | 100.0% |
| Range | 94.8% | 90.5% |
| Mean | 39.0% | 33.0% |
| Median | 26.4% | 24.5% |
| Interquartile 25% (IQ1) | 15.7% | 16.7% |
| Interquartile 75% (IQ3) | 54.8% | 36.6% |
| Interquartile Range (IQR) | 39.1% | 20.0% |
| Standard Deviation (Sample) | 33.0% | 24.2% |
| Standard Deviation (Population) | 31.6% | 24.0% |
Similar Demographics by Single Father Poverty
Demographics Similar to Immigrants from Hungary by Single Father Poverty
In terms of single father poverty, the demographic groups most similar to Immigrants from Hungary are Colombian (16.1%, a difference of 0.080%), Nigerian (16.1%, a difference of 0.10%), Immigrants from Western Asia (16.0%, a difference of 0.16%), South African (16.1%, a difference of 0.20%), and Immigrants from Kuwait (16.0%, a difference of 0.22%).
| Demographics | Rating | Rank | Single Father Poverty |
| South Americans | 85.9 /100 | #139 | Excellent 16.0% |
| Immigrants | Netherlands | 85.3 /100 | #140 | Excellent 16.0% |
| Liberians | 83.3 /100 | #141 | Excellent 16.0% |
| Immigrants | Mexico | 83.3 /100 | #142 | Excellent 16.0% |
| Immigrants | Central America | 83.1 /100 | #143 | Excellent 16.0% |
| Immigrants | Kuwait | 81.4 /100 | #144 | Excellent 16.0% |
| Immigrants | Western Asia | 80.7 /100 | #145 | Excellent 16.0% |
| Immigrants | Hungary | 78.3 /100 | #146 | Good 16.1% |
| Colombians | 77.1 /100 | #147 | Good 16.1% |
| Nigerians | 76.8 /100 | #148 | Good 16.1% |
| South Africans | 75.1 /100 | #149 | Good 16.1% |
| Jordanians | 74.2 /100 | #150 | Good 16.1% |
| Immigrants | France | 73.1 /100 | #151 | Good 16.1% |
| Immigrants | Zimbabwe | 72.1 /100 | #152 | Good 16.1% |
| Immigrants | Israel | 72.0 /100 | #153 | Good 16.1% |
Demographics Similar to Finns by Single Father Poverty
In terms of single father poverty, the demographic groups most similar to Finns are Bermudan (16.9%, a difference of 0.010%), Immigrants from Saudi Arabia (16.9%, a difference of 0.030%), Immigrants from Western Europe (16.9%, a difference of 0.10%), Immigrants from Germany (16.9%, a difference of 0.10%), and Subsaharan African (16.9%, a difference of 0.10%).
| Demographics | Rating | Rank | Single Father Poverty |
| Senegalese | 3.2 /100 | #233 | Tragic 16.9% |
| Marshallese | 3.1 /100 | #234 | Tragic 16.9% |
| Immigrants | Western Europe | 2.9 /100 | #235 | Tragic 16.9% |
| Immigrants | Germany | 2.9 /100 | #236 | Tragic 16.9% |
| Sub-Saharan Africans | 2.9 /100 | #237 | Tragic 16.9% |
| Immigrants | Saudi Arabia | 2.7 /100 | #238 | Tragic 16.9% |
| Bermudans | 2.6 /100 | #239 | Tragic 16.9% |
| Finns | 2.6 /100 | #240 | Tragic 16.9% |
| Czechs | 2.3 /100 | #241 | Tragic 17.0% |
| Moroccans | 2.1 /100 | #242 | Tragic 17.0% |
| Immigrants | Cabo Verde | 1.6 /100 | #243 | Tragic 17.0% |
| Hondurans | 1.6 /100 | #244 | Tragic 17.0% |
| Trinidadians and Tobagonians | 1.5 /100 | #245 | Tragic 17.0% |
| Immigrants | Ireland | 1.4 /100 | #246 | Tragic 17.1% |
| Greeks | 1.3 /100 | #247 | Tragic 17.1% |