Immigrants from Hungary vs Immigrants from Bolivia Single Father Poverty
COMPARE
Immigrants from Hungary
Immigrants from Bolivia
Single Father Poverty
Single Father Poverty Comparison
Immigrants from Hungary
Immigrants from Bolivia
16.1%
SINGLE FATHER POVERTY
78.3/ 100
METRIC RATING
146th/ 347
METRIC RANK
14.7%
SINGLE FATHER POVERTY
100.0/ 100
METRIC RATING
35th/ 347
METRIC RANK
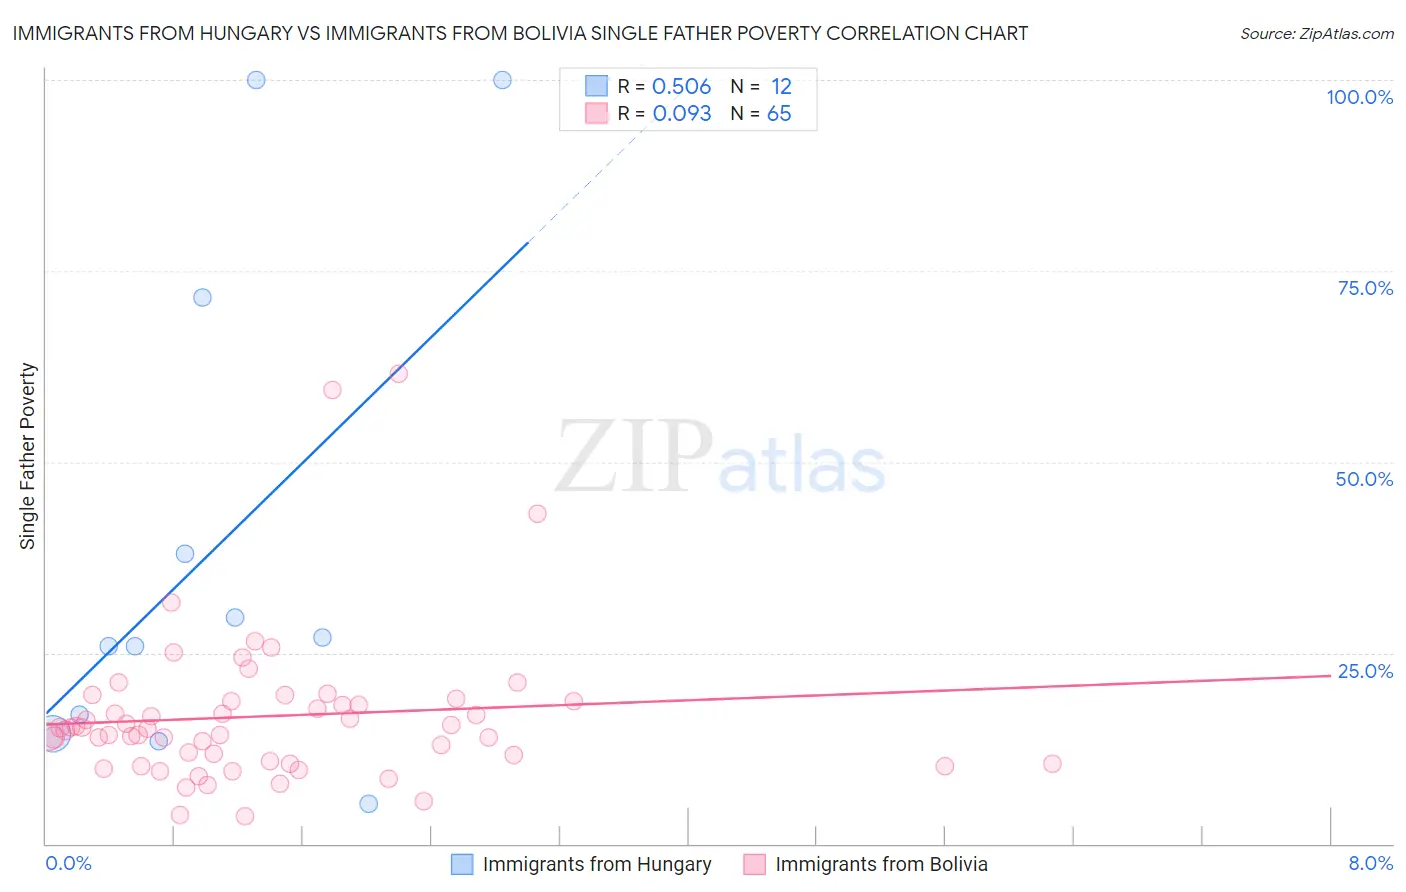
Immigrants from Hungary vs Immigrants from Bolivia Single Father Poverty Correlation Chart
The statistical analysis conducted on geographies consisting of 163,698,265 people shows a substantial positive correlation between the proportion of Immigrants from Hungary and poverty level among single fathers in the United States with a correlation coefficient (R) of 0.506 and weighted average of 16.1%. Similarly, the statistical analysis conducted on geographies consisting of 137,322,784 people shows a slight positive correlation between the proportion of Immigrants from Bolivia and poverty level among single fathers in the United States with a correlation coefficient (R) of 0.093 and weighted average of 14.7%, a difference of 9.5%.
Single Father Poverty Correlation Summary
| Measurement | Immigrants from Hungary | Immigrants from Bolivia |
| Minimum | 5.2% | 3.6% |
| Maximum | 100.0% | 61.5% |
| Range | 94.8% | 58.0% |
| Mean | 39.0% | 16.7% |
| Median | 26.4% | 15.0% |
| Interquartile 25% (IQ1) | 15.7% | 10.6% |
| Interquartile 75% (IQ3) | 54.8% | 18.6% |
| Interquartile Range (IQR) | 39.1% | 8.0% |
| Standard Deviation (Sample) | 33.0% | 10.2% |
| Standard Deviation (Population) | 31.6% | 10.1% |
Similar Demographics by Single Father Poverty
Demographics Similar to Immigrants from Hungary by Single Father Poverty
In terms of single father poverty, the demographic groups most similar to Immigrants from Hungary are Colombian (16.1%, a difference of 0.080%), Nigerian (16.1%, a difference of 0.10%), Immigrants from Western Asia (16.0%, a difference of 0.16%), South African (16.1%, a difference of 0.20%), and Immigrants from Kuwait (16.0%, a difference of 0.22%).
| Demographics | Rating | Rank | Single Father Poverty |
| South Americans | 85.9 /100 | #139 | Excellent 16.0% |
| Immigrants | Netherlands | 85.3 /100 | #140 | Excellent 16.0% |
| Liberians | 83.3 /100 | #141 | Excellent 16.0% |
| Immigrants | Mexico | 83.3 /100 | #142 | Excellent 16.0% |
| Immigrants | Central America | 83.1 /100 | #143 | Excellent 16.0% |
| Immigrants | Kuwait | 81.4 /100 | #144 | Excellent 16.0% |
| Immigrants | Western Asia | 80.7 /100 | #145 | Excellent 16.0% |
| Immigrants | Hungary | 78.3 /100 | #146 | Good 16.1% |
| Colombians | 77.1 /100 | #147 | Good 16.1% |
| Nigerians | 76.8 /100 | #148 | Good 16.1% |
| South Africans | 75.1 /100 | #149 | Good 16.1% |
| Jordanians | 74.2 /100 | #150 | Good 16.1% |
| Immigrants | France | 73.1 /100 | #151 | Good 16.1% |
| Immigrants | Zimbabwe | 72.1 /100 | #152 | Good 16.1% |
| Immigrants | Israel | 72.0 /100 | #153 | Good 16.1% |
Demographics Similar to Immigrants from Bolivia by Single Father Poverty
In terms of single father poverty, the demographic groups most similar to Immigrants from Bolivia are Egyptian (14.7%, a difference of 0.070%), Okinawan (14.6%, a difference of 0.17%), Immigrants from Indonesia (14.7%, a difference of 0.17%), Immigrants from Eastern Africa (14.7%, a difference of 0.29%), and Bolivian (14.7%, a difference of 0.30%).
| Demographics | Rating | Rank | Single Father Poverty |
| Immigrants | South Central Asia | 100.0 /100 | #28 | Exceptional 14.5% |
| Somalis | 100.0 /100 | #29 | Exceptional 14.5% |
| Thais | 100.0 /100 | #30 | Exceptional 14.5% |
| Icelanders | 100.0 /100 | #31 | Exceptional 14.5% |
| Asians | 100.0 /100 | #32 | Exceptional 14.6% |
| Okinawans | 100.0 /100 | #33 | Exceptional 14.6% |
| Egyptians | 100.0 /100 | #34 | Exceptional 14.7% |
| Immigrants | Bolivia | 100.0 /100 | #35 | Exceptional 14.7% |
| Immigrants | Indonesia | 100.0 /100 | #36 | Exceptional 14.7% |
| Immigrants | Eastern Africa | 100.0 /100 | #37 | Exceptional 14.7% |
| Bolivians | 100.0 /100 | #38 | Exceptional 14.7% |
| Immigrants | Asia | 100.0 /100 | #39 | Exceptional 14.7% |
| Pima | 100.0 /100 | #40 | Exceptional 14.8% |
| Indians (Asian) | 100.0 /100 | #41 | Exceptional 14.8% |
| Immigrants | Nepal | 100.0 /100 | #42 | Exceptional 14.8% |