Immigrants from Honduras vs Immigrants from Sierra Leone Single Mother Poverty

COMPARE

Immigrants from Honduras
Race
Ancestry
AfghanAfricanAlaska NativeAlaskan AthabascanAlbanianAleutAlsatianAmericanApacheArabArapahoArgentineanArmenianAssyrian/Chaldean/SyriacAustralianAustrianBahamianBangladeshiBarbadianBasqueBelgianBelizeanBermudanBhutaneseBlackfeetBolivianBrazilianBritishBritish West IndianBulgarianBurmeseCajunCambodianCanadianCape VerdeanCarpatho RusynCelticCentral AmericanCentral American IndianCherokeeCheyenneChickasawChileanChineseChippewaChoctawColombianColvilleComancheCosta RicanCreeCreekCroatianCrowCubanCypriotCzechCzechoslovakianDanishDelawareDominicanDutchDutch West IndianEastern EuropeanEcuadorianEgyptianEnglishEstonianEthiopianEuropeanFijianFilipinoFinnishFrenchFrench American IndianFrench CanadianGermanGerman RussianGhanaianGreekGuamanian/ChamorroGuatemalanGuyaneseHaitianHmongHonduranHopiHoumaHungarianIcelanderIndian (Asian)IndonesianInupiatIranianIraqiIrishIroquoisIsraeliItalianJamaicanJapaneseJordanianKenyanKiowaKoreanLaotianLatvianLebaneseLiberianLithuanianLumbeeLuxembourgerMacedonianMalaysianMalteseMarshalleseMenomineeMexicanMexican American IndianMongolianMoroccanNative HawaiianNavajoNepaleseNew ZealanderNicaraguanNigerianNorthern EuropeanNorwegianOkinawanOsageOttawaPaiutePakistaniPalestinianPanamanianParaguayanPennsylvania GermanPeruvianPimaPolishPortuguesePotawatomiPuebloPuerto RicanPuget Sound SalishRomanianRussianSalvadoranSamoanScandinavianScotch-IrishScottishSeminoleSenegaleseSerbianShoshoneSierra LeoneanSiouxSlavicSlovakSloveneSomaliSouth AfricanSouth AmericanSouth American IndianSoviet UnionSpaniardSpanishSpanish AmericanSpanish American IndianSri LankanSubsaharan AfricanSudaneseSwedishSwissSyrianTaiwaneseThaiTlingit-HaidaTohono O'OdhamTonganTrinidadian and TobagonianTsimshianTurkishU.S. Virgin IslanderUgandanUkrainianUruguayanUteVenezuelanVietnameseWelshWest IndianYakamaYaquiYugoslavianYumanYup'ikZimbabwean
Immigration
NonimmigrantsImmigrantsAfghanistanAfricaAlbaniaArgentinaArmeniaAsiaAustraliaAustriaBahamasBangladeshBarbadosBelarusBelgiumBelizeBoliviaBosnia and HerzegovinaBrazilBulgariaBurma/MyanmarCabo VerdeCambodiaCameroonCanadaCaribbeanCentral AmericaChileChinaColombiaCongoCosta RicaCroatiaCubaCzechoslovakiaDenmarkDominicaDominican RepublicEastern AfricaEastern AsiaEastern EuropeEcuadorEgyptEl SalvadorEnglandEritreaEthiopiaEuropeFijiFranceGermanyGhanaGreeceGrenadaGuatemalaGuyanaHaitiHondurasHong KongHungaryIndiaIndonesiaIranIraqIrelandIsraelItalyJamaicaJapanJordanKazakhstanKenyaKoreaKuwaitLaosLatin AmericaLatviaLebanonLiberiaLithuaniaMalaysiaMexicoMicronesiaMiddle AfricaMoldovaMoroccoNepalNetherlandsNicaraguaNigeriaNorth AmericaNorth MacedoniaNorthern AfricaNorthern EuropeNorwayOceaniaPakistanPanamaPeruPhilippinesPolandPortugalRomaniaRussiaSaudi ArabiaScotlandSenegalSerbiaSingaporeSomaliaSouth AfricaSouth AmericaSouth Central AsiaSouth Eastern AsiaSouthern EuropeSpainSri LankaSt. Vincent and the GrenadinesSudanSwedenSwitzerlandSyriaTaiwanThailandTrinidad and TobagoTurkeyUgandaUkraineUruguayUzbekistanVenezuelaVietnamWest IndiesWestern AfricaWestern AsiaWestern EuropeYemenZaireZimbabweAzores
Immigrants from Sierra Leone
Race
Ancestry
AfghanAfricanAlaska NativeAlaskan AthabascanAlbanianAleutAlsatianAmericanApacheArabArapahoArgentineanArmenianAssyrian/Chaldean/SyriacAustralianAustrianBahamianBangladeshiBarbadianBasqueBelgianBelizeanBermudanBhutaneseBlackfeetBolivianBrazilianBritishBritish West IndianBulgarianBurmeseCajunCambodianCanadianCape VerdeanCarpatho RusynCelticCentral AmericanCentral American IndianCherokeeCheyenneChickasawChileanChineseChippewaChoctawColombianColvilleComancheCosta RicanCreeCreekCroatianCrowCubanCypriotCzechCzechoslovakianDanishDelawareDominicanDutchDutch West IndianEastern EuropeanEcuadorianEgyptianEnglishEstonianEthiopianEuropeanFijianFilipinoFinnishFrenchFrench American IndianFrench CanadianGermanGerman RussianGhanaianGreekGuamanian/ChamorroGuatemalanGuyaneseHaitianHmongHonduranHopiHoumaHungarianIcelanderIndian (Asian)IndonesianInupiatIranianIraqiIrishIroquoisIsraeliItalianJamaicanJapaneseJordanianKenyanKiowaKoreanLaotianLatvianLebaneseLiberianLithuanianLumbeeLuxembourgerMacedonianMalaysianMalteseMarshalleseMenomineeMexicanMexican American IndianMongolianMoroccanNative HawaiianNavajoNepaleseNew ZealanderNicaraguanNigerianNorthern EuropeanNorwegianOkinawanOsageOttawaPaiutePakistaniPalestinianPanamanianParaguayanPennsylvania GermanPeruvianPimaPolishPortuguesePotawatomiPuebloPuerto RicanPuget Sound SalishRomanianRussianSalvadoranSamoanScandinavianScotch-IrishScottishSeminoleSenegaleseSerbianShoshoneSierra LeoneanSiouxSlavicSlovakSloveneSomaliSouth AfricanSouth AmericanSouth American IndianSoviet UnionSpaniardSpanishSpanish AmericanSpanish American IndianSri LankanSubsaharan AfricanSudaneseSwedishSwissSyrianTaiwaneseThaiTlingit-HaidaTohono O'OdhamTonganTrinidadian and TobagonianTsimshianTurkishU.S. Virgin IslanderUgandanUkrainianUruguayanUteVenezuelanVietnameseWelshWest IndianYakamaYaquiYugoslavianYumanYup'ikZimbabwean
Immigration
NonimmigrantsImmigrantsAfghanistanAfricaAlbaniaArgentinaArmeniaAsiaAustraliaAustriaBahamasBangladeshBarbadosBelarusBelgiumBelizeBoliviaBosnia and HerzegovinaBrazilBulgariaBurma/MyanmarCabo VerdeCambodiaCameroonCanadaCaribbeanCentral AmericaChileChinaColombiaCongoCosta RicaCroatiaCubaCzechoslovakiaDenmarkDominicaDominican RepublicEastern AfricaEastern AsiaEastern EuropeEcuadorEgyptEl SalvadorEnglandEritreaEthiopiaEuropeFijiFranceGermanyGhanaGreeceGrenadaGuatemalaGuyanaHaitiHong KongHungaryIndiaIndonesiaIranIraqIrelandIsraelItalyJamaicaJapanJordanKazakhstanKenyaKoreaKuwaitLaosLatin AmericaLatviaLebanonLiberiaLithuaniaMalaysiaMexicoMicronesiaMiddle AfricaMoldovaMoroccoNepalNetherlandsNicaraguaNigeriaNorth AmericaNorth MacedoniaNorthern AfricaNorthern EuropeNorwayOceaniaPakistanPanamaPeruPhilippinesPolandPortugalRomaniaRussiaSaudi ArabiaScotlandSenegalSerbiaSierra LeoneSingaporeSomaliaSouth AfricaSouth AmericaSouth Central AsiaSouth Eastern AsiaSouthern EuropeSpainSri LankaSt. Vincent and the GrenadinesSudanSwedenSwitzerlandSyriaTaiwanThailandTrinidad and TobagoTurkeyUgandaUkraineUruguayUzbekistanVenezuelaVietnamWest IndiesWestern AfricaWestern AsiaWestern EuropeYemenZaireZimbabweAzores
Single Mother Poverty
Income
Poverty
Unemployment
Labor Participation
Family Structure
Vehicle Availability
Education Level
Disability

Single Mother Poverty Comparison

Immigrants from Honduras

Immigrants from Sierra Leone

Tragic
Exceptional
34.7%
SINGLE MOTHER POVERTY
0.0/ 100
METRIC RATING
318th/ 347
METRIC RANK
26.9%
SINGLE MOTHER POVERTY
99.9/ 100
METRIC RATING
44th/ 347
METRIC RANK

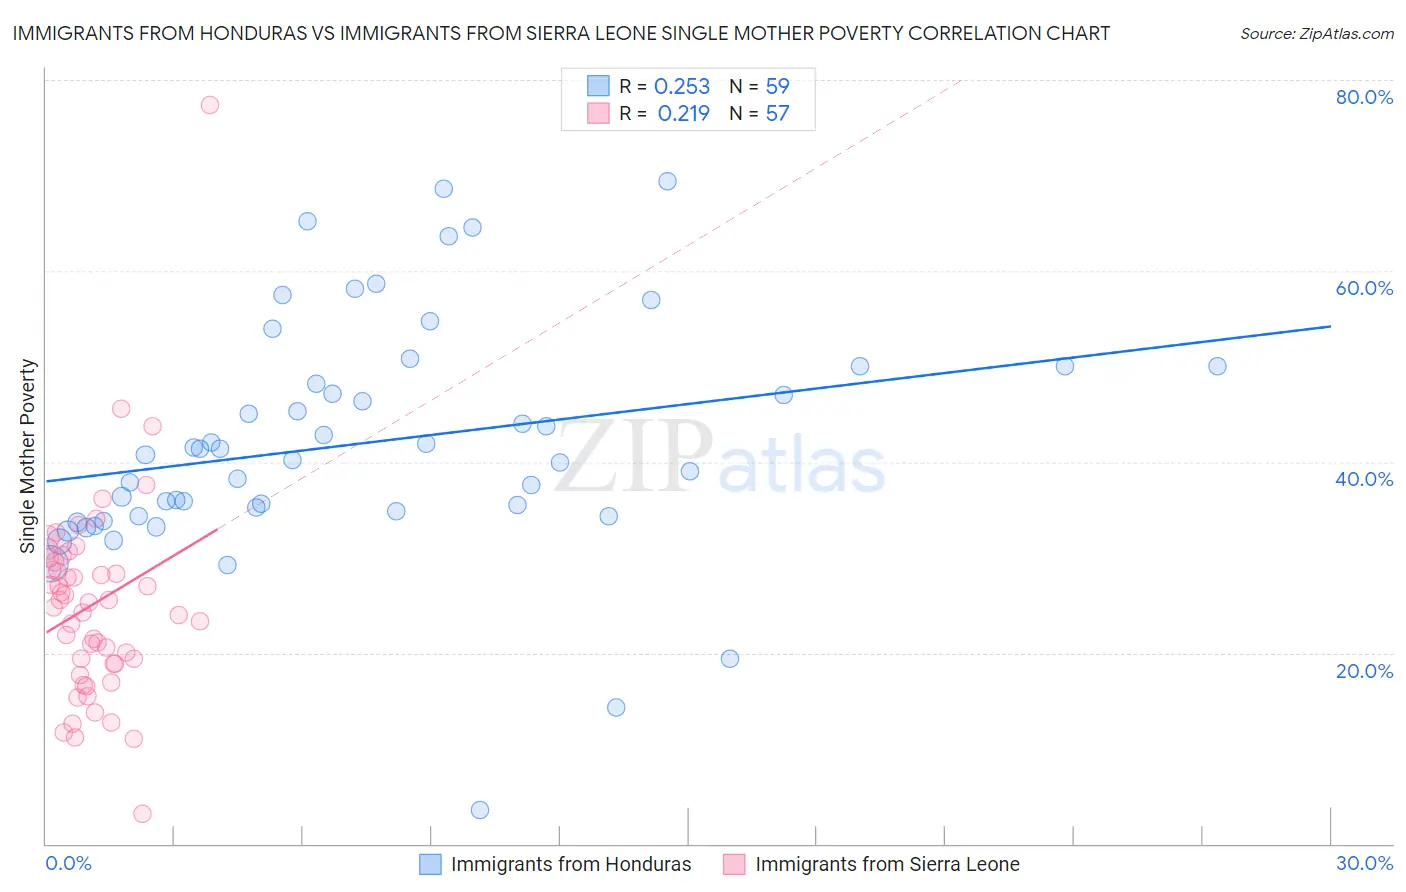
Immigrants from Honduras vs Immigrants from Sierra Leone Single Mother Poverty Correlation Chart

The statistical analysis conducted on geographies consisting of 318,969,615 people shows a weak positive correlation between the proportion of Immigrants from Honduras and poverty level among single mothers in the United States with a correlation coefficient (R) of 0.253 and weighted average of 34.7%. Similarly, the statistical analysis conducted on geographies consisting of 101,102,212 people shows a weak positive correlation between the proportion of Immigrants from Sierra Leone and poverty level among single mothers in the United States with a correlation coefficient (R) of 0.219 and weighted average of 26.9%, a difference of 29.2%.
Immigrants from Honduras vs Immigrants from Sierra Leone Single Mother Poverty

Single Mother Poverty Correlation Summary

MeasurementImmigrants from HondurasImmigrants from Sierra Leone
Minimum3.6%3.1%
Maximum69.4%77.3%
Range65.9%74.2%
Mean42.0%25.1%
Median40.7%25.2%
Interquartile 25% (IQ1)34.3%18.9%
Interquartile 75% (IQ3)50.0%29.7%
Interquartile Range (IQR)15.7%10.9%
Standard Deviation (Sample)12.4%10.8%
Standard Deviation (Population)12.3%10.7%

Similar Demographics by Single Mother Poverty

Demographics Similar to Immigrants from Honduras by Single Mother Poverty

In terms of single mother poverty, the demographic groups most similar to Immigrants from Honduras are Chippewa (34.8%, a difference of 0.15%), Iroquois (34.8%, a difference of 0.39%), Cherokee (34.5%, a difference of 0.52%), Dominican (34.5%, a difference of 0.63%), and Hopi (34.5%, a difference of 0.75%).
DemographicsRating | RankSingle Mother Poverty
Alsatians
0.0
/100
|
#311
Tragic
34.3%
Central American Indians
0.0
/100
|
#312
Tragic
34.3%
Immigrants | Dominican Republic
0.0
/100
|
#313
Tragic
34.4%
Chickasaw
0.0
/100
|
#314
Tragic
34.4%
Hopi
0.0
/100
|
#315
Tragic
34.5%
Dominicans
0.0
/100
|
#316
Tragic
34.5%
Cherokee
0.0
/100
|
#317
Tragic
34.5%
Immigrants | Honduras
0.0
/100
|
#318
Tragic
34.7%
Chippewa
0.0
/100
|
#319
Tragic
34.8%
Iroquois
0.0
/100
|
#320
Tragic
34.8%
Paiute
0.0
/100
|
#321
Tragic
35.1%
Blacks/African Americans
0.0
/100
|
#322
Tragic
35.2%
Kiowa
0.0
/100
|
#323
Tragic
35.5%
Ottawa
0.0
/100
|
#324
Tragic
35.5%
Ute
0.0
/100
|
#325
Tragic
35.7%

Demographics Similar to Immigrants from Sierra Leone by Single Mother Poverty

In terms of single mother poverty, the demographic groups most similar to Immigrants from Sierra Leone are Latvian (26.9%, a difference of 0.070%), Immigrants from Serbia (26.9%, a difference of 0.12%), Tsimshian (26.8%, a difference of 0.14%), Egyptian (26.9%, a difference of 0.18%), and Armenian (26.8%, a difference of 0.22%).
DemographicsRating | RankSingle Mother Poverty
Immigrants | Israel
99.9
/100
|
#37
Exceptional
26.6%
Immigrants | Fiji
99.9
/100
|
#38
Exceptional
26.6%
Sri Lankans
99.9
/100
|
#39
Exceptional
26.7%
Immigrants | Vietnam
99.9
/100
|
#40
Exceptional
26.7%
Immigrants | Greece
99.9
/100
|
#41
Exceptional
26.7%
Armenians
99.9
/100
|
#42
Exceptional
26.8%
Tsimshian
99.9
/100
|
#43
Exceptional
26.8%
Immigrants | Sierra Leone
99.9
/100
|
#44
Exceptional
26.9%
Latvians
99.9
/100
|
#45
Exceptional
26.9%
Immigrants | Serbia
99.9
/100
|
#46
Exceptional
26.9%
Egyptians
99.8
/100
|
#47
Exceptional
26.9%
Immigrants | Poland
99.8
/100
|
#48
Exceptional
26.9%
Cambodians
99.8
/100
|
#49
Exceptional
27.0%
Laotians
99.8
/100
|
#50
Exceptional
27.0%
Immigrants | Argentina
99.7
/100
|
#51
Exceptional
27.1%