Immigrants from Haiti vs Black/African American Female Poverty Among 18-24 Year Olds

COMPARE

Immigrants from Haiti
Race
Ancestry
AfghanAfricanAlaska NativeAlaskan AthabascanAlbanianAleutAlsatianAmericanApacheArabArapahoArgentineanArmenianAssyrian/Chaldean/SyriacAustralianAustrianBahamianBangladeshiBarbadianBasqueBelgianBelizeanBermudanBhutaneseBlackfeetBolivianBrazilianBritishBritish West IndianBulgarianBurmeseCajunCambodianCanadianCape VerdeanCarpatho RusynCelticCentral AmericanCentral American IndianCherokeeCheyenneChickasawChileanChineseChippewaChoctawColombianColvilleComancheCosta RicanCreeCreekCroatianCrowCubanCypriotCzechCzechoslovakianDanishDelawareDominicanDutchDutch West IndianEastern EuropeanEcuadorianEgyptianEnglishEstonianEthiopianEuropeanFijianFilipinoFinnishFrenchFrench American IndianFrench CanadianGermanGerman RussianGhanaianGreekGuamanian/ChamorroGuatemalanGuyaneseHaitianHmongHonduranHopiHoumaHungarianIcelanderIndian (Asian)IndonesianInupiatIranianIraqiIrishIroquoisIsraeliItalianJamaicanJapaneseJordanianKenyanKiowaKoreanLaotianLatvianLebaneseLiberianLithuanianLumbeeLuxembourgerMacedonianMalaysianMalteseMarshalleseMenomineeMexicanMexican American IndianMongolianMoroccanNative HawaiianNavajoNepaleseNew ZealanderNicaraguanNigerianNorthern EuropeanNorwegianOkinawanOsageOttawaPaiutePakistaniPalestinianPanamanianParaguayanPennsylvania GermanPeruvianPimaPolishPortuguesePotawatomiPuebloPuerto RicanPuget Sound SalishRomanianRussianSalvadoranSamoanScandinavianScotch-IrishScottishSeminoleSenegaleseSerbianShoshoneSierra LeoneanSiouxSlavicSlovakSloveneSomaliSouth AfricanSouth AmericanSouth American IndianSoviet UnionSpaniardSpanishSpanish AmericanSpanish American IndianSri LankanSubsaharan AfricanSudaneseSwedishSwissSyrianTaiwaneseThaiTlingit-HaidaTohono O'OdhamTonganTrinidadian and TobagonianTsimshianTurkishU.S. Virgin IslanderUgandanUkrainianUruguayanUteVenezuelanVietnameseWelshWest IndianYakamaYaquiYugoslavianYumanYup'ikZimbabwean
Immigration
NonimmigrantsImmigrantsAfghanistanAfricaAlbaniaArgentinaArmeniaAsiaAustraliaAustriaBahamasBangladeshBarbadosBelarusBelgiumBelizeBoliviaBosnia and HerzegovinaBrazilBulgariaBurma/MyanmarCabo VerdeCambodiaCameroonCanadaCaribbeanCentral AmericaChileChinaColombiaCongoCosta RicaCroatiaCubaCzechoslovakiaDenmarkDominicaDominican RepublicEastern AfricaEastern AsiaEastern EuropeEcuadorEgyptEl SalvadorEnglandEritreaEthiopiaEuropeFijiFranceGermanyGhanaGreeceGrenadaGuatemalaGuyanaHaitiHondurasHong KongHungaryIndiaIndonesiaIranIraqIrelandIsraelItalyJamaicaJapanJordanKazakhstanKenyaKoreaKuwaitLaosLatin AmericaLatviaLebanonLiberiaLithuaniaMalaysiaMexicoMicronesiaMiddle AfricaMoldovaMoroccoNepalNetherlandsNicaraguaNigeriaNorth AmericaNorth MacedoniaNorthern AfricaNorthern EuropeNorwayOceaniaPakistanPanamaPeruPhilippinesPolandPortugalRomaniaRussiaSaudi ArabiaScotlandSenegalSerbiaSierra LeoneSingaporeSomaliaSouth AfricaSouth AmericaSouth Central AsiaSouth Eastern AsiaSouthern EuropeSpainSri LankaSt. Vincent and the GrenadinesSudanSwedenSwitzerlandSyriaTaiwanThailandTrinidad and TobagoTurkeyUgandaUkraineUruguayUzbekistanVenezuelaVietnamWest IndiesWestern AfricaWestern AsiaWestern EuropeYemenZaireZimbabweAzores
Black/African American
Race
Ancestry
AfghanAfricanAlaska NativeAlaskan AthabascanAlbanianAleutAlsatianAmericanApacheArabArapahoArgentineanArmenianAssyrian/Chaldean/SyriacAustralianAustrianBahamianBangladeshiBarbadianBasqueBelgianBelizeanBermudanBhutaneseBlackfeetBolivianBrazilianBritishBritish West IndianBulgarianBurmeseCajunCambodianCanadianCape VerdeanCarpatho RusynCelticCentral AmericanCentral American IndianCherokeeCheyenneChickasawChileanChineseChippewaChoctawColombianColvilleComancheCosta RicanCreeCreekCroatianCrowCubanCypriotCzechCzechoslovakianDanishDelawareDominicanDutchDutch West IndianEastern EuropeanEcuadorianEgyptianEnglishEstonianEthiopianEuropeanFijianFilipinoFinnishFrenchFrench American IndianFrench CanadianGermanGerman RussianGhanaianGreekGuamanian/ChamorroGuatemalanGuyaneseHaitianHmongHonduranHopiHoumaHungarianIcelanderIndian (Asian)IndonesianInupiatIranianIraqiIrishIroquoisIsraeliItalianJamaicanJapaneseJordanianKenyanKiowaKoreanLaotianLatvianLebaneseLiberianLithuanianLumbeeLuxembourgerMacedonianMalaysianMalteseMarshalleseMenomineeMexicanMexican American IndianMongolianMoroccanNative HawaiianNavajoNepaleseNew ZealanderNicaraguanNigerianNorthern EuropeanNorwegianOkinawanOsageOttawaPaiutePakistaniPalestinianPanamanianParaguayanPennsylvania GermanPeruvianPimaPolishPortuguesePotawatomiPuebloPuerto RicanPuget Sound SalishRomanianRussianSalvadoranSamoanScandinavianScotch-IrishScottishSeminoleSenegaleseSerbianShoshoneSierra LeoneanSiouxSlavicSlovakSloveneSomaliSouth AfricanSouth AmericanSouth American IndianSoviet UnionSpaniardSpanishSpanish AmericanSpanish American IndianSri LankanSubsaharan AfricanSudaneseSwedishSwissSyrianTaiwaneseThaiTlingit-HaidaTohono O'OdhamTonganTrinidadian and TobagonianTsimshianTurkishU.S. Virgin IslanderUgandanUkrainianUruguayanUteVenezuelanVietnameseWelshWest IndianYakamaYaquiYugoslavianYumanYup'ikZimbabwean
Immigration
NonimmigrantsImmigrantsAfghanistanAfricaAlbaniaArgentinaArmeniaAsiaAustraliaAustriaBahamasBangladeshBarbadosBelarusBelgiumBelizeBoliviaBosnia and HerzegovinaBrazilBulgariaBurma/MyanmarCabo VerdeCambodiaCameroonCanadaCaribbeanCentral AmericaChileChinaColombiaCongoCosta RicaCroatiaCubaCzechoslovakiaDenmarkDominicaDominican RepublicEastern AfricaEastern AsiaEastern EuropeEcuadorEgyptEl SalvadorEnglandEritreaEthiopiaEuropeFijiFranceGermanyGhanaGreeceGrenadaGuatemalaGuyanaHondurasHong KongHungaryIndiaIndonesiaIranIraqIrelandIsraelItalyJamaicaJapanJordanKazakhstanKenyaKoreaKuwaitLaosLatin AmericaLatviaLebanonLiberiaLithuaniaMalaysiaMexicoMicronesiaMiddle AfricaMoldovaMoroccoNepalNetherlandsNicaraguaNigeriaNorth AmericaNorth MacedoniaNorthern AfricaNorthern EuropeNorwayOceaniaPakistanPanamaPeruPhilippinesPolandPortugalRomaniaRussiaSaudi ArabiaScotlandSenegalSerbiaSierra LeoneSingaporeSomaliaSouth AfricaSouth AmericaSouth Central AsiaSouth Eastern AsiaSouthern EuropeSpainSri LankaSt. Vincent and the GrenadinesSudanSwedenSwitzerlandSyriaTaiwanThailandTrinidad and TobagoTurkeyUgandaUkraineUruguayUzbekistanVenezuelaVietnamWest IndiesWestern AfricaWestern AsiaWestern EuropeYemenZaireZimbabweAzores
Female Poverty Among 18-24 Year Olds
Income
Poverty
Unemployment
Labor Participation
Family Structure
Vehicle Availability
Education Level
Disability

Female Poverty Among 18-24 Year Olds Comparison

Immigrants from Haiti

Blacks/African Americans

Exceptional
Tragic
18.7%
FEMALE POVERTY AMONG 18-24 YEAR OLDS
99.7/ 100
METRIC RATING
71st/ 347
METRIC RANK
24.3%
FEMALE POVERTY AMONG 18-24 YEAR OLDS
0.0/ 100
METRIC RATING
315th/ 347
METRIC RANK

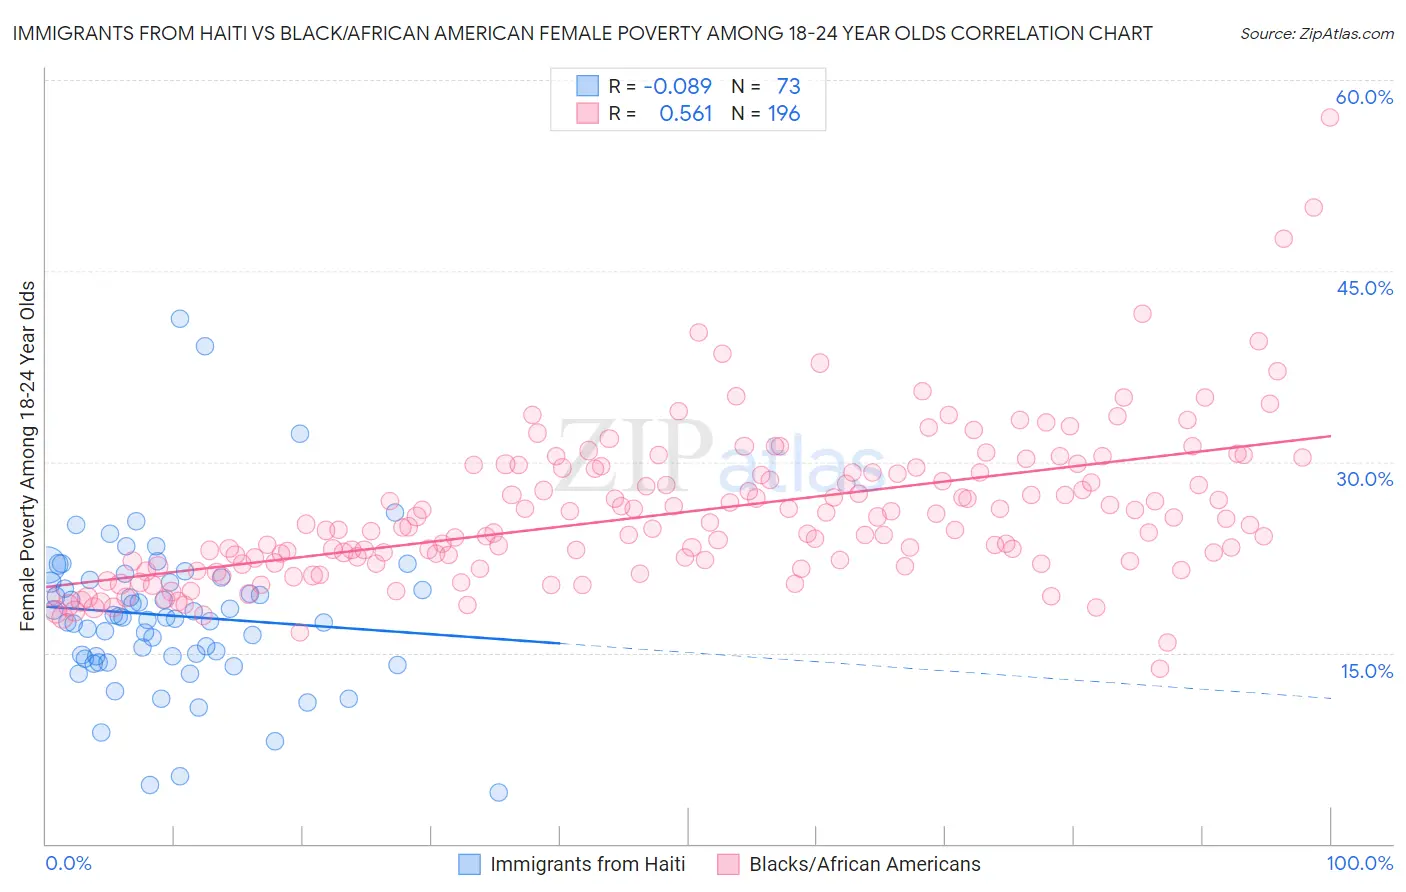
Immigrants from Haiti vs Black/African American Female Poverty Among 18-24 Year Olds Correlation Chart

The statistical analysis conducted on geographies consisting of 221,211,252 people shows a slight negative correlation between the proportion of Immigrants from Haiti and poverty level among females between the ages 18 and 24 in the United States with a correlation coefficient (R) of -0.089 and weighted average of 18.7%. Similarly, the statistical analysis conducted on geographies consisting of 536,191,091 people shows a substantial positive correlation between the proportion of Blacks/African Americans and poverty level among females between the ages 18 and 24 in the United States with a correlation coefficient (R) of 0.561 and weighted average of 24.3%, a difference of 30.1%.
Immigrants from Haiti vs Black/African American Female Poverty Among 18-24 Year Olds

Female Poverty Among 18-24 Year Olds Correlation Summary

MeasurementImmigrants from HaitiBlack/African American
Minimum4.0%13.7%
Maximum41.2%57.1%
Range37.2%43.4%
Mean17.9%26.0%
Median17.7%24.8%
Interquartile 25% (IQ1)14.6%22.0%
Interquartile 75% (IQ3)20.7%29.2%
Interquartile Range (IQR)6.0%7.2%
Standard Deviation (Sample)6.2%6.0%
Standard Deviation (Population)6.1%6.0%

Similar Demographics by Female Poverty Among 18-24 Year Olds

Demographics Similar to Immigrants from Haiti by Female Poverty Among 18-24 Year Olds

In terms of female poverty among 18-24 year olds, the demographic groups most similar to Immigrants from Haiti are Armenian (18.7%, a difference of 0.020%), Immigrants from Costa Rica (18.7%, a difference of 0.060%), Lithuanian (18.7%, a difference of 0.060%), Immigrants from Bulgaria (18.6%, a difference of 0.17%), and Hawaiian (18.7%, a difference of 0.24%).
DemographicsRating | RankFemale Poverty Among 18-24 Year Olds
Immigrants | Asia
99.8
/100
|
#64
Exceptional
18.6%
Immigrants | Scotland
99.8
/100
|
#65
Exceptional
18.6%
Jordanians
99.8
/100
|
#66
Exceptional
18.6%
Immigrants | Korea
99.8
/100
|
#67
Exceptional
18.6%
Brazilians
99.8
/100
|
#68
Exceptional
18.6%
Immigrants | Bulgaria
99.7
/100
|
#69
Exceptional
18.6%
Immigrants | Costa Rica
99.7
/100
|
#70
Exceptional
18.7%
Immigrants | Haiti
99.7
/100
|
#71
Exceptional
18.7%
Armenians
99.7
/100
|
#72
Exceptional
18.7%
Lithuanians
99.7
/100
|
#73
Exceptional
18.7%
Hawaiians
99.6
/100
|
#74
Exceptional
18.7%
Poles
99.6
/100
|
#75
Exceptional
18.8%
Immigrants | Cambodia
99.5
/100
|
#76
Exceptional
18.8%
Costa Ricans
99.5
/100
|
#77
Exceptional
18.8%
Immigrants | Europe
99.5
/100
|
#78
Exceptional
18.8%

Demographics Similar to Blacks/African Americans by Female Poverty Among 18-24 Year Olds

In terms of female poverty among 18-24 year olds, the demographic groups most similar to Blacks/African Americans are Choctaw (24.3%, a difference of 0.20%), Alsatian (24.4%, a difference of 0.31%), Creek (24.2%, a difference of 0.36%), Osage (24.5%, a difference of 0.60%), and Chickasaw (24.5%, a difference of 0.69%).
DemographicsRating | RankFemale Poverty Among 18-24 Year Olds
Immigrants | Sudan
0.0
/100
|
#308
Tragic
23.5%
Blackfeet
0.0
/100
|
#309
Tragic
23.6%
Comanche
0.0
/100
|
#310
Tragic
23.6%
Potawatomi
0.0
/100
|
#311
Tragic
23.7%
Yuman
0.0
/100
|
#312
Tragic
24.0%
Creek
0.0
/100
|
#313
Tragic
24.2%
Choctaw
0.0
/100
|
#314
Tragic
24.3%
Blacks/African Americans
0.0
/100
|
#315
Tragic
24.3%
Alsatians
0.0
/100
|
#316
Tragic
24.4%
Osage
0.0
/100
|
#317
Tragic
24.5%
Chickasaw
0.0
/100
|
#318
Tragic
24.5%
Dutch West Indians
0.0
/100
|
#319
Tragic
24.5%
Immigrants | Congo
0.0
/100
|
#320
Tragic
24.6%
Immigrants | Zaire
0.0
/100
|
#321
Tragic
25.1%
Somalis
0.0
/100
|
#322
Tragic
25.1%